










Runwal Enterprises Q2 sales rise 7.5% as pricing lifts value
Key highlights
- Runwal's Q2 FY27 sales value rose 7.5% year on year to Rs 609.3 crore.
- Q2 FY27 average selling price increased 11.8% to Rs 14,097 per square foot.
- Q2 FY27 collections increased 23.5% year on year to Rs 550.1 crore.
- Runwal delivered 0.90 msf in Q2 FY27 versus nil in Q2 FY26.
powered by IRIS
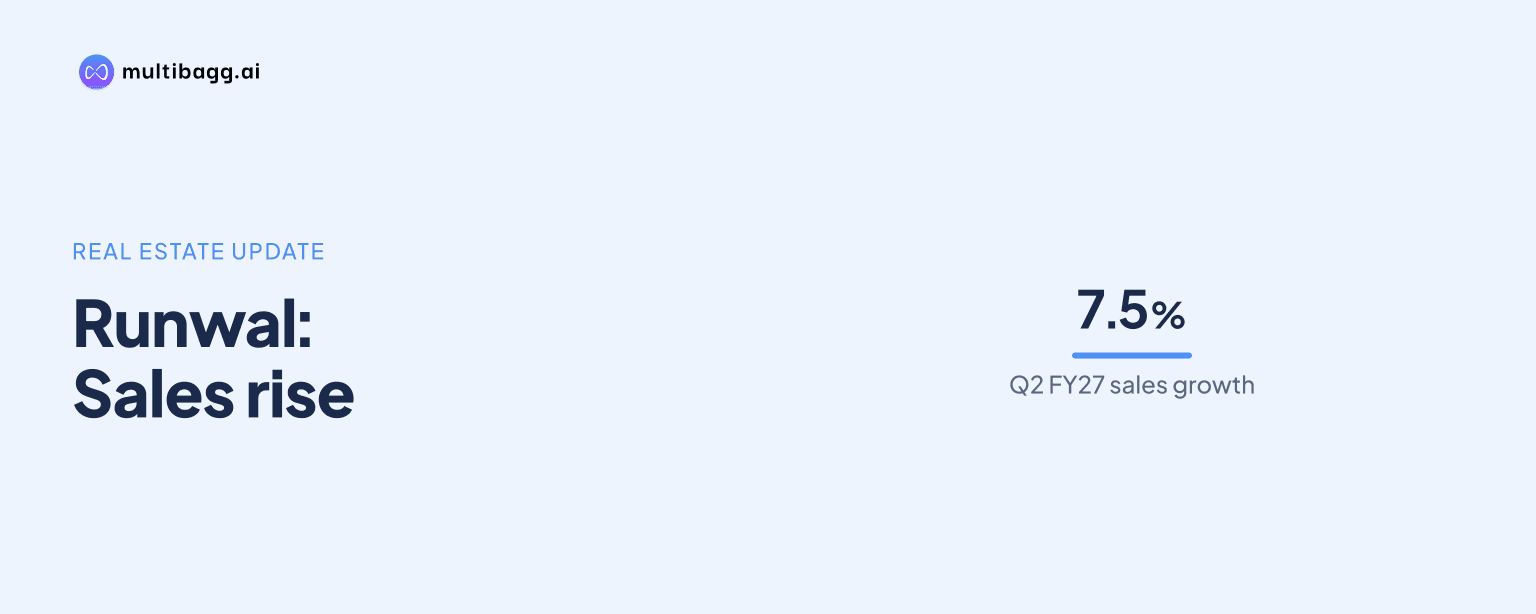
Runwal Enterprises recorded sales value of Rs 609.3 crore in the second quarter of financial year 2027 (Q2 FY27), up 7.5% year on year, as average selling price rose 11.8% to Rs 14,097 per square foot despite units sold declining 16.7% to 380. Collections increased 23.5% to Rs 550.1 crore and delivered area reached 0.90 million square feet (msf).
Know Runwal Enterprises inside out
Results, valuation, peers and who's buying, in one view.
How did Runwal's Q2 sales value change?
Runwal's Q2 FY27 sales value increased to Rs 609.3 crore from Rs 566.6 crore in Q2 FY26, a 7.5% rise. The company defines sales value as the agreement value of residential, retail and commercial units sold, net of cancellations, where agreements have been entered into and the booking amount received. It excludes taxes, other charges, stamp duty and registration charges.
The operating sales-value increase differed from the movement in reported revenue. Revenue from operations fell 38.5% year on year to Rs 411.69 crore in Q2 FY27 from Rs 669.4 crore, while gross profit was Rs 104.24 crore and gross margin was 25.3%. Runwal reported profit after tax of Rs 5.78 crore, showing that sales value and accounting revenue are separately reported measures.
Did higher prices offset lower unit sales for Runwal?
Yes. Runwal's disclosed Q2 FY27 average selling price rose by Rs 1,486 per square foot to Rs 14,097 from Rs 12,611 in Q2 FY26, while sales area declined to 0.43 msf from 0.45 msf. The 11.8% increase in the blended price per square foot was accompanied by the 7.5% increase in sales value.
Units sold fell by 76 to 380 in Q2 FY27 from 456 a year earlier, while sales area was lower by 0.02 msf. Runwal calculates average selling price by dividing sales value by saleable sales area. Its presentation does not provide project-level prices, product mix, cancellation data or separate residential, retail and commercial pricing that would explain the change in average selling price.
The difference between unit and area trends is material in the disclosed operating data. Units sold declined 16.7%, compared with a 4.4% reduction in sales area, so the number of units booked did not move one-for-one with saleable area. The company reports one average selling price for its residential, retail and commercial projects rather than segment-level Q2 FY27 realisations.
Got a follow-up? Ask IRIS
How did Runwal's collections and deliveries perform in Q2?
Runwal's gross collections rose 23.5% to Rs 550.1 crore in Q2 FY27 from Rs 445.3 crore in Q2 FY26, exceeding the 7.5% growth in sales value. Gross collections are collections against agreement value from unit sales, net of cancellations, and exclude taxes and other charges. The year-on-year increase in collections was Rs 104.8 crore.
Delivered area was 0.90 msf in Q2 FY27, compared with nil in Q2 FY26. Runwal counts inventory as delivered when it receives an occupation certificate. The presentation does not identify the residential, retail or commercial split of the 0.90 msf, or link the delivered area to quarterly sales value and collections.
Runwal also reported a net debt-to-equity ratio of 1.51 times in its Q2 FY27 highlights. Alongside that figure, the company disclosed Rs 104.24 crore of gross profit and Rs 5.78 crore of profit after tax. These financial measures are reported alongside operating indicators, but the company uses distinct definitions for booking-linked sales value, collections and occupation-certificate-linked deliveries.
What do Runwal's first-half operating figures show?
Runwal's first half of FY27 (H1 FY27) sales value increased to Rs 1,092.8 crore from Rs 1,026.5 crore in H1 FY26, a rise of Rs 66.3 crore. Average selling price increased to Rs 14,143 per square foot from Rs 12,422, while sales area decreased to 0.77 msf from 0.83 msf and units sold fell to 700 from 854.
H1 FY27 collections reached Rs 1,125.5 crore, compared with Rs 944.7 crore in H1 FY26, an increase of Rs 180.8 crore. Area delivered rose to 1.90 msf from 0.86 msf, an increase of 1.04 msf. Over the six-month period, both collections and delivered area increased while sales area and units sold declined.
The H1 data extend the Q2 pattern: price per square foot was higher, while both booked area and unit sales were lower than the prior-year period. The H1 average selling price was Rs 1,721 per square foot above H1 FY26, compared with the Q2 increase of Rs 1,486 per square foot. Deliveries of 1.90 msf in H1 FY27 included the 0.90 msf reported in Q2.
Conclusion
Runwal's Q2 FY27 operating data show that a higher average selling price supported sales-value growth despite fewer units sold and lower sales area. Sales value increased 7.5% to Rs 609.3 crore, while collections rose 23.5% to Rs 550.1 crore and deliveries moved from nil in Q2 FY26 to 0.90 msf. The first-half figures show the same mix of higher realisations and lower volume measures.
The next operating update will show whether Runwal can sustain sales-value growth as unit sales and sales area remain below their prior-year levels. The disclosed data leave unresolved the project mix, segment mix and cancellation trends behind the higher average selling price, while future occupation certificates will determine the pace of delivered area beyond the 1.90 msf reported for H1 FY27.