










Rushil Decor Limited cuts inventory days as net debt rises
Key highlights
- Rushil Decor’s annualised inventory days fell by 49 days to 146 in H1 FY2027 from 195 in FY2026.
- Rushil Decor’s net debt increased by Rs 17.2 crore to Rs 271.5 crore at September 30, 2026.
- Short-term borrowings rose by Rs 30.1 crore to Rs 192.9 crore, while long-term debt fell by Rs 11.2 crore.
- H1 FY2027 operating cash flow was Rs 47.6 crore, offset by a Rs 32.7 crore working-capital movement.
powered by IRIS
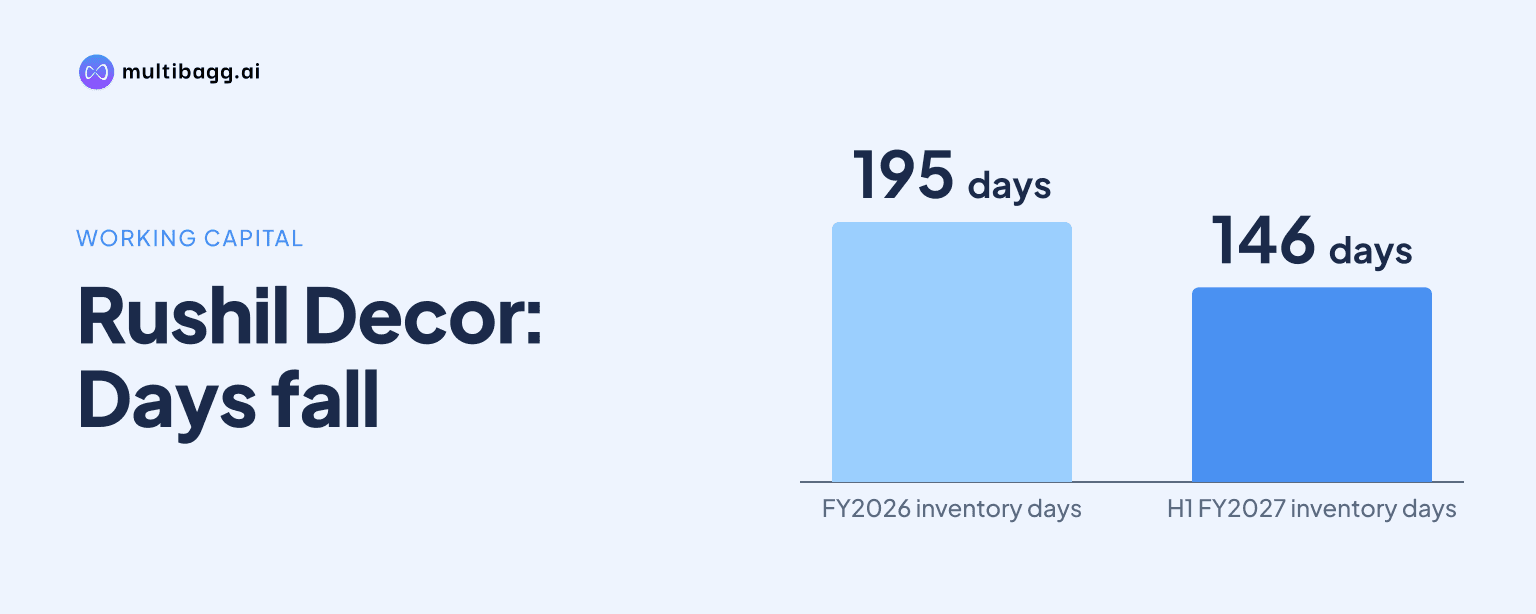
Rushil Decor Limited cut annualised inventory days by 49 days to 146 in the first half (H1) of financial year 2027 (FY2027), while net debt rose by Rs 17.2 crore to Rs 271.5 crore at September 30, 2026. Lower inventories coincided with higher receivables and short-term borrowings.
Know Rushil Decor inside out
Results, valuation, peers and who's buying, in one view.
Why did Rushil Decor’s net debt increase in H1 FY2027?
Rushil Decor’s net debt increased because total debt rose to Rs 278.8 crore at September 2026 from Rs 259.9 crore at March 2026, exceeding the increase in cash and cash equivalents to Rs 7.4 crore from Rs 5.5 crore. The capital-structure table reports net debt of Rs 271.5 crore at September 2026, against Rs 254.3 crore at the FY2026 close.
The borrowing mix shifted further towards short-term debt during the six months. Long-term debt declined by Rs 11.2 crore to Rs 85.9 crore, while short-term debt increased by Rs 30.1 crore to Rs 192.9 crore. The increase in short-term borrowing exceeded the fall in long-term debt, resulting in a Rs 18.9 crore increase in total debt.
Net debt to equity was 0.41 times at September 2026, compared with 0.39 times in March 2026 and 0.41 times in March 2025. Total equity increased by Rs 11 crore during H1 FY2027 to Rs 661.9 crore, including other equity of Rs 632.5 crore, but debt increased faster than equity over the six-month period.
What changed in Rushil Decor’s working capital?
Rushil Decor reduced inventory, while trade receivables increased and reported payment days shortened. Inventories fell by Rs 17.8 crore to Rs 244.2 crore at September 2026 from Rs 262 crore at March 2026. On an annualised basis, inventory days declined to 146 in H1 FY2027 from 195 in FY2026.
The 49-day reduction followed a three-year increase in stock holding days. Inventory days rose from 170 in FY2024 to 177 in FY2025 and then 195 in FY2026. The September 2026 inventory balance of Rs 244.2 crore was accompanied by the lowest inventory-days figure across the four periods shown, although the H1 FY2027 figure is annualised rather than a full-year measure.
Trade receivables moved in the opposite direction in rupee terms. Current trade receivables increased by Rs 61.7 crore to Rs 257.1 crore at September 2026, while non-current trade receivables rose by Rs 3.3 crore to Rs 7.3 crore. Annualised receivables days nevertheless declined to 78 from 81 in FY2026, after increasing from 61 days in FY2024 and 71 days in FY2025.
Trade payables also increased in rupee terms, although their days declined. Dues to micro and small enterprises rose to Rs 22.1 crore from Rs 15.6 crore, and dues to other than micro and small enterprises increased to Rs 258.6 crore from Rs 250.8 crore. Total reported trade payables therefore increased by Rs 14.3 crore to Rs 280.7 crore, while payables days fell to 157 from 189 in FY2026.
Got a follow-up? Ask IRIS
How did cash flow contribute to Rushil Decor’s debt movement?
Rushil Decor reported operating cash flow of Rs 47.6 crore in H1 FY2027, but a Rs 32.7 crore change in working capital absorbed most of that amount. After tax paid of Rs 30 lakh, the cash-flow analysis indicates Rs 14.6 crore before investing, financing and bank-balance movements.
Investing activity used Rs 14.3 crore in H1 FY2027, nearly matching the amount remaining after the working-capital movement and tax paid. The balance sheet shows capital work in progress of Rs 13.9 crore at September 2026, up from Rs 10.7 crore at March 2026, while property, plant and equipment declined to Rs 720.5 crore from Rs 726.3 crore.
The cash-flow bridge separately records a Rs 18.9 crore change in debt, financing activity of Rs 6 lakh and a Rs 9 lakh change in bank balance. Starting from FY2026 net debt of Rs 254.3 crore, these movements resulted in H1 FY2027 net debt of Rs 271.5 crore. The presentation labels the position as net cash or debt, with the negative balance denoting net debt.
Cash and cash equivalents were Rs 7.4 crore at September 2026, compared with short-term borrowings of Rs 192.9 crore. The consolidated balance sheet reports Rs 1.4 crore of cash and cash equivalents and Rs 6 crore of bank balances other than cash, which together match the Rs 7.4 crore shown in the capital-structure table.
What does the balance-sheet movement show alongside H1 FY2027 earnings?
Rushil Decor’s H1 FY2027 revenue growth coincided with higher receivables and debt. Consolidated revenue from operations rose 26.4% year on year to Rs 524.3 crore from Rs 414.8 crore, while reported earnings before interest, tax, depreciation and amortisation (EBITDA) increased to Rs 46.2 crore from Rs 20.3 crore.
The earnings improvement did not eliminate the working-capital cash movement reported in the cash-flow statement. Trade receivables of Rs 257.1 crore at September 2026 exceeded inventories of Rs 244.2 crore, whereas receivables were Rs 195.4 crore and inventories were Rs 262 crore at March 2026. This changed the relative size of the two principal current-asset balances.
Finance cost increased to Rs 16.3 crore in H1 FY2027 from Rs 15.5 crore in H1 FY2026. Profit after tax was Rs 12.1 crore, compared with a loss after tax of Rs 8.9 crore a year earlier, and the reported profit-after-tax margin was 2.3%. The presentation therefore records a return to profit alongside higher net debt at the half-year point.
Conclusion
Rushil Decor’s September 2026 balance sheet shows divergent working-capital movements: inventory declined by Rs 17.8 crore and inventory days fell from 195 to 146, while current trade receivables increased by Rs 61.7 crore and short-term debt rose by Rs 30.1 crore. Operating cash flow of Rs 47.6 crore was substantially offset by a Rs 32.7 crore working-capital movement and Rs 14.3 crore of investing activity, leaving net debt at Rs 271.5 crore.
The presentation provides no debt-reduction target, future capital-spending plan or scheduled balance-sheet milestone. The next reported update will show whether the annualised H1 FY2027 working-capital days, including 146 inventory days and 78 receivables days, are sustained while short-term debt stands at Rs 192.9 crore.