










Amanta cuts debt-to-equity to 1.06x in FY26 after NCD repayment
Key highlights
- Amanta's debt-to-equity ratio fell from 3.43 times in FY23 to 1.06 times in FY26.
- Amanta reported Rs 220 crore of net worth in FY26, up from Rs 63 crore in FY23.
- Amanta's FY26 finance cost was Rs 21 crore, versus Rs 35 crore in FY23.
- Amanta recorded Rs 126 crore of financing cash inflow and Rs 81 crore of year-end cash in FY26.
powered by IRIS
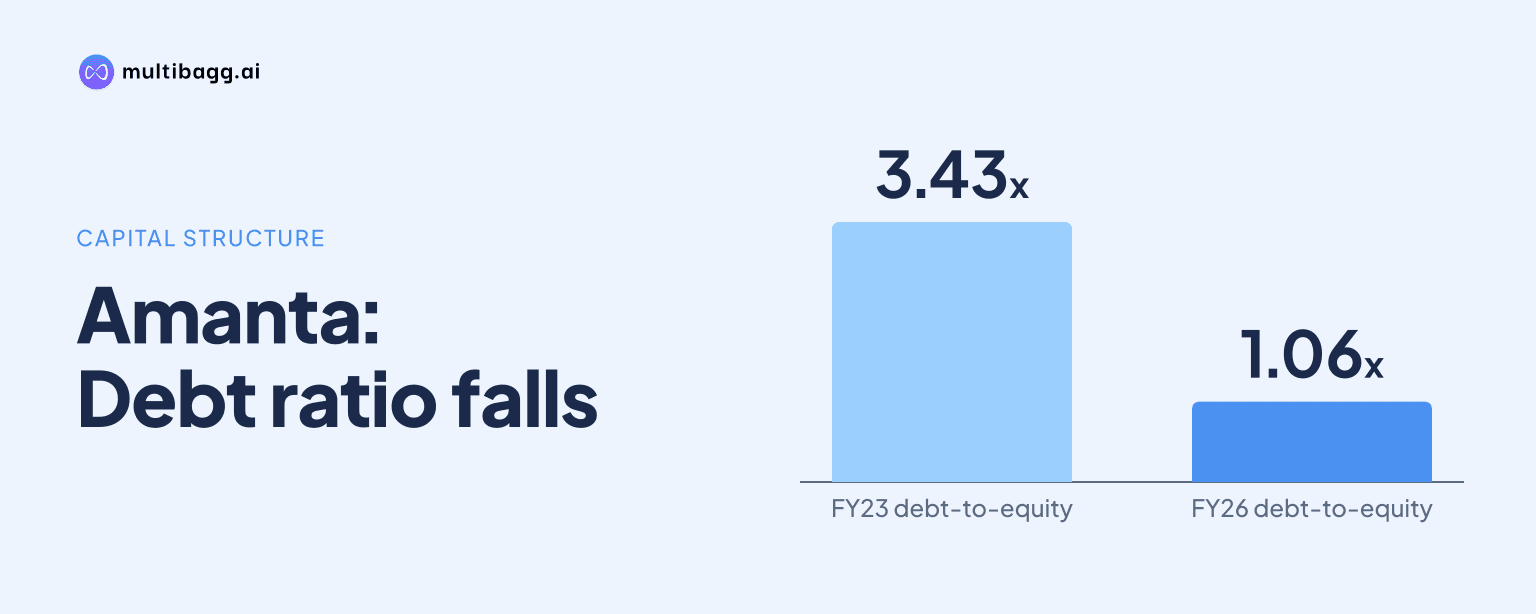
Amanta reduced its debt-to-equity ratio to 1.06 times in FY26 from 3.43 times in FY23, while reporting full repayment of outstanding Non-Convertible Debentures (NCDs). The change coincided with net worth rising to Rs 220 crore from Rs 63 crore, and finance costs falling to Rs 21 crore from Rs 35 crore.
Know Amanta Healthcare inside out
Results, valuation, peers and who's buying, in one view.
How did Amanta's debt-to-equity ratio change from FY23 to FY26?
Amanta's debt-to-equity ratio fell in each of the four reported years, reaching 1.06 times in FY26 from 3.43 times in FY23. The presentation describes this as a reduction of over 70% since FY23 and attributes the reduction in part to the full repayment of all outstanding NCDs. The ratio was 3.10 times in FY24 and 2.02 times in FY25 before reaching the FY26 level.
Debt-service coverage did not follow the same uninterrupted path. It declined from 1.19 times in FY23 to 0.76 times in FY24 and 0.37 times in FY25, then increased to 1.24 times in FY26. FY26 was the first year in the period when debt-to-equity was near one time and debt-service coverage was above the FY23 level.
The NCD repayment is specifically identified by Amanta as the primary reason total borrowings were reduced by over Rs 30 crore. The supplied presentation does not state the repayment date, the coupon on the NCDs, or the proportion of FY26 borrowings that replaced the retired instruments. It does separately show borrowings classified as current and non-current at every year-end.
What changed in Amanta's balance sheet during the deleveraging period?
Amanta's net worth expanded by Rs 157 crore, from Rs 63 crore in FY23 to Rs 220 crore in FY26, providing the other major change behind the lower reported gearing ratio. Equity share capital increased from Rs 27 crore to Rs 39 crore over the period, while other equity rose from Rs 36 crore to Rs 181 crore. Net worth had already reached Rs 96 crore in FY25 before more than doubling in FY26.
The balance sheet shows non-current borrowings falling to Rs 162 crore in FY26 from Rs 176 crore in FY23, although they were Rs 132 crore in FY25. Current borrowings moved in the other direction, rising to Rs 72 crore in FY26 from Rs 40 crore in FY23 and Rs 63 crore in FY25. On the face of these classifications, current plus non-current borrowings were Rs 234 crore in FY26, compared with Rs 216 crore in FY23.
That classification comparison differs from the deleveraging page's statement that total borrowings were reduced by more than Rs 30 crore, principally through NCD repayment. Amanta does not provide a reconciliation between that statement and the current and non-current borrowing balances in the annual balance-sheet table. The disclosed evidence nevertheless shows a clear change in mix: FY26 had Rs 72 crore of current borrowings and Rs 162 crore of non-current borrowings, alongside a much larger Rs 220 crore net-worth base.
Total assets increased to Rs 558 crore in FY26 from Rs 374 crore in FY23. The increase included capital work-in-progress of Rs 82 crore in FY26, where none was shown for FY23, and cash and cash equivalents of Rs 81 crore in the FY26 balance sheet, compared with a zero rounded balance in FY23. Total current assets rose to Rs 238 crore from Rs 131 crore, while total non-current assets rose to Rs 320 crore from Rs 243 crore.
Got a follow-up? Ask IRIS
What does Amanta's cash flow show about FY26 financing?
Amanta reported Rs 48 crore of cash flow from operating activities in FY26, close to Rs 47 crore in FY25 but below Rs 58 crore in FY24. Investing cash outflow rose sharply to Rs 94 crore in FY26 from Rs 25 crore in FY25, while cash flow from financing activities switched to an inflow of Rs 126 crore from an outflow of Rs 24 crore.
The financing inflow and operating cash generation together exceeded the reported FY26 investing outflow, resulting in year-end cash and cash equivalents of Rs 81 crore. Cash at the end of FY25 was Rs 20 lakh, compared with Rs 1.5 crore in FY24 and Rs 10 lakh in FY23, according to the cash-flow statement. The FY26 balance-sheet cash figure is also Rs 81 crore, aligning with the year-end cash-flow figure.
Amanta's presentation separately labels Rs 130 crore of capital expenditure as FY26P, after Rs 10 crore in FY25 and Rs 12 crore in FY24. It lists Rs 25 crore for FY27P. The stated uses for the programme are capacity scale-up across lines, renewable-energy or solar-power integration, and accelerated product rollouts; the presentation does not allocate the Rs 126 crore FY26 financing inflow among those uses, debt repayment, or other purposes.
How did Amanta's earnings and finance costs change as leverage improved?
Amanta's finance costs fell to Rs 21 crore in FY26 from Rs 35 crore in FY23, with Rs 28 crore in FY25 and Rs 34 crore in FY24. This decline occurred as earnings before interest, tax, depreciation and amortisation, or EBITDA, increased to Rs 63 crore in FY26 from Rs 56 crore in FY23. EBITDA was Rs 59 crore in FY24 and Rs 61 crore in FY25.
Revenue increased to Rs 288 crore in FY26 from Rs 259 crore in FY23, after Rs 280 crore in FY24 and Rs 275 crore in FY25. Sale of products accounted for Rs 282 crore of FY26 revenue, while sale of services contributed Rs 3 crore, scrap sales Rs 2 crore and export incentives Rs 2 crore. The presentation's rounded revenue components do not precisely add to its stated Rs 288 crore total.
Profit before tax rose to Rs 21 crore in FY26 from Rs 3 crore in FY23, while profit after tax reached Rs 15 crore after a Rs 2 crore loss in FY23. FY26 included Rs 3 crore of exceptional items, which were not reported in FY23 through FY25. Total expenditure was Rs 228 crore in FY26, compared with Rs 206 crore in FY23, while total income rose to Rs 291 crore from Rs 263 crore.
Conclusion
Amanta's reported debt-to-equity improvement from 3.43 times in FY23 to 1.06 times in FY26 reflects both the stated repayment of all outstanding NCDs and a substantial expansion in net worth to Rs 220 crore. Lower finance costs of Rs 21 crore, higher EBITDA of Rs 63 crore and a recovery in debt-service coverage to 1.24 times provide the operating and cash-generation context for the FY26 position.
The next disclosed item to watch is Amanta's FY27P capital-expenditure plan of Rs 25 crore, following the Rs 130 crore FY26P programme. Readers can also monitor whether the company provides a bridge between its statement of more than Rs 30 crore of total-borrowing reduction and the balance-sheet movement in current and non-current borrowings, which together were Rs 234 crore in FY26.