










Sai Life Sciences’ Q2 revenue rose 23% as margins slipped
Key highlights
- Sai reported Q2FY27 revenue of Rs 659 crore, up 23% from Rs 537 crore in Q2FY26.
- Sai’s Q2FY27 EBITDA margin declined to 28% from 29%, while PAT margin declined to 15% from 16%.
- Q2FY27 material margin was Rs 484 crore, up 22%, while its margin reduced to 73% from 74%.
- Sai incurred Rs 621 crore of capital expenditure in H1FY27, including Rs 358 crore in Q2.
powered by IRIS
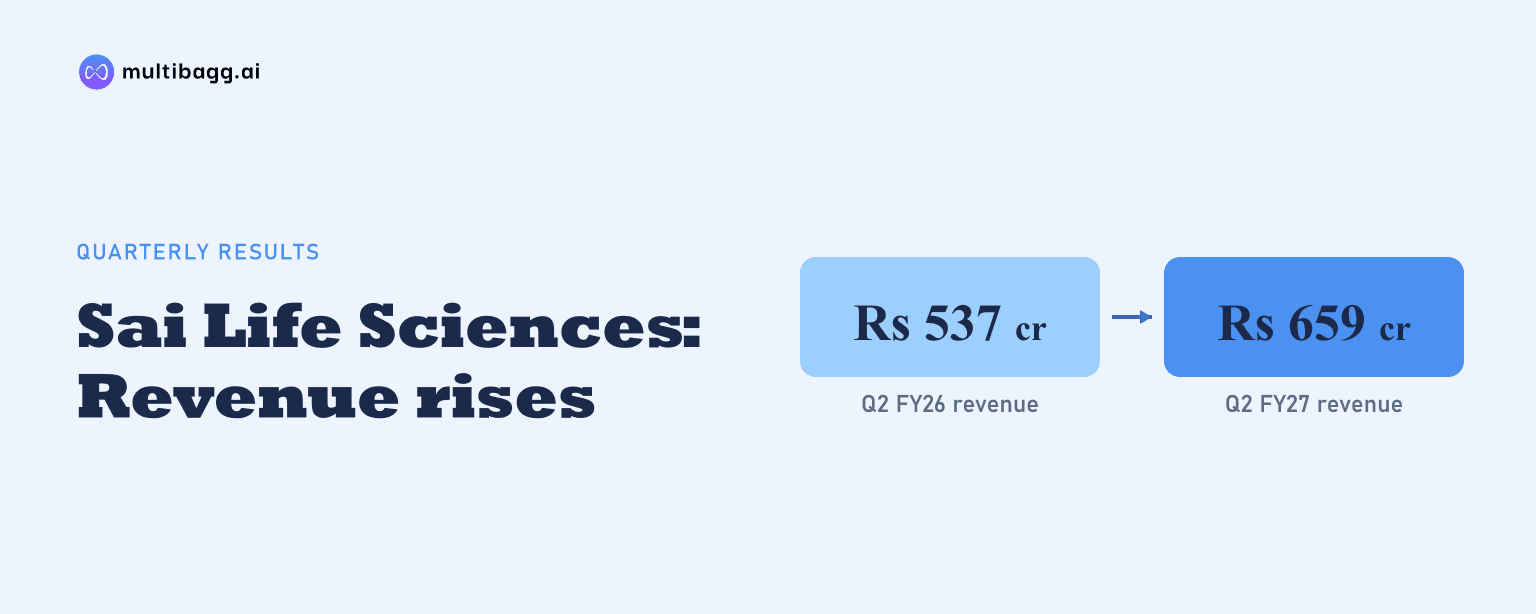
In Q2FY27, Sai Life Sciences Limited increased revenue 23% to Rs 659 crore, while EBITDA and PAT margins each fell by one percentage point year on year. Sai reported EBITDA of Rs 187 crore, up 20%, and PAT of Rs 98 crore, up 17%, meaning both profit measures grew more slowly than revenue.
Know Sai Life Sciences inside out
Results, valuation, peers and who's buying, in one view.
What did Sai report in Q2FY27?
Sai reported consolidated Q2FY27 revenue of Rs 659 crore, compared with Rs 537 crore in Q2FY26, an increase of Rs 122 crore. Material margin rose 22% to Rs 484 crore from Rs 397 crore, while earnings before interest, tax, depreciation and amortisation, or EBITDA, increased 20% to Rs 187 crore from Rs 156 crore. Sai states that EBITDA includes foreign-exchange effects.
PAT increased by Rs 14 crore to Rs 98 crore in Q2FY27 from Rs 84 crore a year earlier. Revenue grew 23%, compared with 22% growth in material margin, 20% in EBITDA and 17% in PAT. The different growth rates resulted in lower reported margins for all three profitability measures.
Why did Sai’s Q2FY27 margins decline despite revenue growth?
Sai did not state a specific cause for the margin movements, but its reported profitability increased more slowly than Q2FY27 revenue. Material margin declined to 73% from 74% in Q2FY26, EBITDA margin fell to 28% from 29%, and PAT margin reduced to 15% from 16%. Each movement was one percentage point year on year.
The difference between Sai’s revenue and material-margin figures increased to Rs 175 crore in Q2FY27 from Rs 140 crore in Q2FY26. That is a calculated Rs 35 crore change, against a Rs 122 crore increase in revenue. The presentation does not provide a quarterly breakdown of costs underlying material margin, so it does not establish what caused that difference.
EBITDA increased by Rs 31 crore, from Rs 156 crore to Rs 187 crore, but the revenue base increased faster at 23%. PAT followed the same pattern, rising by Rs 14 crore while its margin declined to 15%. The presentation identifies EBITDA as including forex but gives no separate forex amount for either quarter.
How did Q2FY27 compare with Sai’s H1FY27 performance?
Sai’s H1FY27 revenue increased 17% to Rs 1,213 crore from Rs 1,034 crore in H1FY26, slower than the 23% growth recorded in Q2FY27. H1FY27 material margin grew 19% to Rs 893 crore, and EBITDA also grew 19% to Rs 335 crore. The Q2 growth rates for EBITDA and PAT, at 20% and 17%, differed from the 19% growth stated for both measures in the half-year snapshot.
Margins improved in the H1 comparison for material margin and EBITDA, unlike the Q2 comparison. H1FY27 material margin was 74%, against 73% in H1FY26, while EBITDA margin was 28%, against 27%. In Q2FY27, material margin was 73% and EBITDA margin 28%, compared with 74% and 29% respectively a year earlier.
Sai’s half-year PAT table is headed “Consolidated Financial Highlights (Half Yearly)” but labels its amount rows Q2FY26 and Q2FY27. It shows Rs 144 crore and Rs 172 crore, both with 14% margins, while the H1FY27 snapshot also reports PAT of Rs 172 crore. These figures are separate from the quarterly PAT amounts of Rs 84 crore and Rs 98 crore.
Got a follow-up? Ask IRIS
What business mix and investment details did Sai disclose?
Sai reported that contract development and manufacturing organisation, or CDMO, work represented 64% of Q2FY27 revenue, while contract research organisation, or CRO, work represented 36%. The H1FY27 snapshot showed 62% CDMO and 38% CRO revenue mix. The Q2 mix was therefore two percentage points more weighted toward CDMO than the half-year snapshot.
Sai reported 67% capacity utilisation in Q2FY27 and capital expenditure of Rs 358 crore during the quarter. Its H1FY27 capital expenditure was Rs 621 crore, so Q2 represented more than half of spending disclosed for the first six months. Management said Sai remained on track for an FY27 capital-expenditure projection of Rs 1,100 crore to Rs 1,300 crore.
Sai said it had commenced operations on its first end-to-end integrated collaboration, which was onboarded in the previous quarter and was expected to be fully functional in Q3. It also said it had converted another large-pharma relationship into a similar strategic engagement and was in discussions with a few additional large-pharma companies to expand the integrated outsourcing model.
The company added one molecule to its late-phase pipeline and advanced one molecule from late phase to commercial status. Sai also said Units 2 and 4 received Zero Waste to Landfill Platinum certification, with more than 95% of waste diverted from landfills. The presentation does not quantify any Q2FY27 revenue, cost or margin contribution from these operational developments.
Conclusion
Sai’s Q2FY27 performance combined a Rs 122 crore increase in revenue with slower growth in material margin, EBITDA and PAT. Revenue rose 23% to Rs 659 crore, while EBITDA rose 20% to Rs 187 crore and PAT increased 17% to Rs 98 crore. This produced one-percentage-point year-on-year declines in material, EBITDA and PAT margins, even as H1FY27 showed higher material and EBITDA margins than H1FY26.
The next disclosed milestone is full functionality of Sai’s first integrated collaboration in Q3. Management’s FY27 capital-expenditure projection of Rs 1,100 crore to Rs 1,300 crore is also a stated item to watch, alongside whether 67% Q2 capacity utilisation and the 64% CDMO revenue mix coincide with changes in later revenue growth and margins.