










Sanathan Textiles revenue gains 22% as EBITDA margin falls
Key highlights
- Sanathan Textiles’ standalone Q2 FY27 revenue increased 22.0% quarter on quarter to Rs 992.1 crore.
- Standalone EBITDA declined 11.7% quarter on quarter to Rs 83.8 crore as total expense rose 26.5%.
- Standalone EBITDA margin fell 320 basis points from 11.7% to 8.5% in Q2 FY27.
- Consolidated EBITDA increased 43.2% quarter on quarter to Rs 154.7 crore, supported by the Punjab facility ramp-up.
powered by IRIS
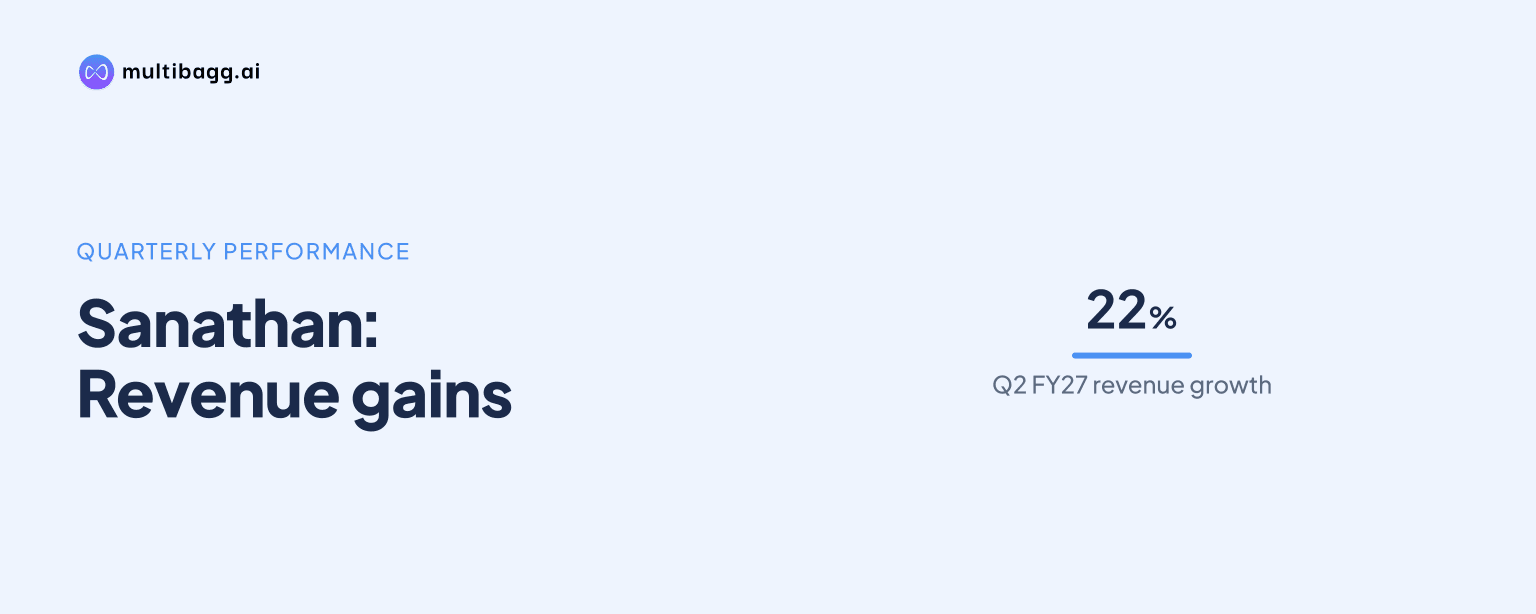
Sanathan Textiles Limited lifted standalone revenue from operations 22.0% quarter on quarter to Rs 992.1 crore in Q2 FY27, but earnings before interest, tax, depreciation and amortisation (EBITDA) fell 11.7% to Rs 83.8 crore as spreads moderated and operating expenses increased, reducing EBITDA margin by 320 basis points to 8.5%.
Know Sanathan Textiles inside out
Results, valuation, peers and who's buying, in one view.
Why did Sanathan Textiles revenue rise in Q2 FY27?
Sanathan Textiles’ standalone revenue rose because higher selling prices lifted revenue from operations from Rs 813.1 crore in Q1 FY27 to Rs 992.1 crore in Q2 FY27. That Rs 179.0 crore increase was reported alongside higher finished-goods sales, which increased from 0.52 lakh MTPA in Q1 FY27 to 0.58 lakh MTPA in Q2 FY27. MTPA means metric tonnes per annum, as used in the presentation.
Production also increased, although at a lower rate than sales. Standalone production moved from 0.54 lakh MTPA in Q1 FY27 to 0.56 lakh MTPA in Q2 FY27, while sales increased by 0.06 lakh MTPA. Sanathan Textiles specifically attributed the revenue increase to higher selling prices, rather than solely to the 0.06 lakh MTPA sales-volume gain.
What caused Sanathan Textiles’ standalone margin decline?
Sanathan Textiles’ standalone margin declined because total expense grew 26.5% to Rs 908.3 crore, faster than the 22.0% revenue increase, while spreads moderated in Q2 FY27. EBITDA excluding other income therefore fell by Rs 11.1 crore from Rs 94.9 crore in Q1 FY27 to Rs 83.8 crore in Q2 FY27. The resulting EBITDA margin fell from 11.7% to 8.5%, a 320-basis-point reduction.
The pressure was also visible in unit earnings. Standalone EBITDA per tonne declined 22.2% quarter on quarter to Rs 14,330 in Q2 FY27. The financial-performance summary on page 5 presents the Q2 FY27 EBITDA margin as 8.4%, whereas the detailed standalone table on page 7 reports 8.5% and a 320-basis-point decline from 11.7%; both disclosures show a sequential reduction in margin.
PAT also declined with EBITDA. PAT fell from Rs 64.9 crore in Q1 FY27 to Rs 58.7 crore in Q2 FY27, and PAT margin reduced from 8.0% to 5.9%, or 210 basis points. Other income rose 3.1% to Rs 16.2 crore, but depreciation increased 3.8% to Rs 13.3 crore and finance cost rose 5.0% to Rs 12.1 crore, leaving profit before tax at Rs 74.6 crore, down 13.6% quarter on quarter.
Got a follow-up? Ask IRIS
How did Sanathan Textiles’ Q2 FY27 standalone result compare with Q2 FY26?
Sanathan Textiles’ standalone revenue, EBITDA and PAT were higher than in Q2 FY26, although margins were lower. Revenue rose 29.3% from Rs 767.1 crore to Rs 992.1 crore, EBITDA increased 17.7% from Rs 71.2 crore to Rs 83.8 crore, and PAT grew 15.8% from Rs 50.6 crore to Rs 58.7 crore. EBITDA margin, however, was 80 basis points below the Q2 FY26 level of 9.3%.
The company attributed the year-on-year EBITDA increase to expanded spreads compared with Q2 FY26, contrasting with moderated spreads compared with Q1 FY27. PAT margin also moved lower year on year, from 6.6% in Q2 FY26 to 5.9% in Q2 FY27, a 70-basis-point decline. Thus, the Q2 FY27 standalone operation generated higher absolute profit than a year earlier, but lower earnings margins.
The consolidated result moved differently from the standalone result because the Punjab facility ramp-up supported volumes and operating performance. Consolidated revenue rose 35.2% quarter on quarter to Rs 1,804.0 crore, EBITDA rose 43.2% to Rs 154.7 crore, and EBITDA margin improved 50 basis points to 8.6% in Q2 FY27. Management attributed the consolidated EBITDA increase to the Punjab facility’s operating performance.
Consolidated finished-goods sales increased from 0.96 lakh MTPA in Q1 FY27 to 1.22 lakh MTPA in Q2 FY27, while production increased from 1.05 lakh MTPA to 1.16 lakh MTPA. Consolidated PAT increased from Rs 23.8 crore to Rs 61.2 crore. Management said the facility ramp-up led to higher volumes, better fixed-cost absorption and higher margins in the consolidated business.
What balance-sheet movements followed Q2 FY27?
Sanathan Textiles’ standalone total assets were Rs 3,184.7 crore at September 2026, compared with Rs 3,138.3 crore at March 2026. Plant, property and equipment, including capital work in progress, increased 3.3% to Rs 898.8 crore, while other non-current assets rose 4.0% to Rs 1,337.5 crore. Net worth increased 6.1% to Rs 2,154.0 crore over the six-month period.
Standalone working-capital items showed mixed movements at September 2026. Inventory declined 12.8% from Rs 558.2 crore at March 2026 to Rs 486.9 crore, while trade receivables increased 17.8% to Rs 181.6 crore. Cash and cash equivalents rose from Rs 2.1 crore to Rs 38.9 crore, and short-term borrowings fell 63.4% from Rs 149.6 crore to Rs 54.8 crore.
At the consolidated level, total assets increased 6.6% to Rs 5,024.5 crore at September 2026, while plant, property and equipment including capital work in progress rose 3.5% to Rs 3,177.0 crore. Consolidated long-term borrowings were Rs 1,285.2 crore, 1.0% above March 2026, and trade payables increased 26.1% to Rs 1,376.1 crore. The presentation provides these balance-sheet changes but does not directly connect them to the standalone Q2 FY27 margin reduction.
Conclusion
Sanathan Textiles’ Q2 FY27 results show that higher selling prices and a 0.06 lakh MTPA increase in standalone sales lifted revenue, but did not preserve the preceding quarter’s profitability. Revenue increased 22.0% while total expense rose 26.5%, causing EBITDA per tonne to decline 22.2% and EBITDA margin to fall from 11.7% to 8.5%. The consolidated business, supported by Punjab facility volumes and fixed-cost absorption, delivered higher revenue, EBITDA and margin.
The next disclosure should show whether management’s stated plan to improve efficiency, expand capacity and focus on margins can counter moderated spreads and higher operating expenses. Management said the Punjab facility was contributing meaningfully to volumes and that capacity utilisation improved in Q2 FY27; future results will indicate whether that ramp-up continues and whether standalone margin moves above the Q2 FY27 level.