










Sanstar moves to Rs 11.7 crore net debt after H1 spending
Key highlights
- Sanstar reported Rs 204.1 crore of investing cash outflow in H1 FY27.
- Sanstar moved from Rs 3.7 crore of net cash at FY26 to Rs 11.7 crore of net debt in H1 FY27.
- Sanstar’s total debt reached Rs 30.8 crore in H1 FY27, including Rs 23.2 crore of short-term debt.
- Sanstar reported Rs 23.4 crore of operating cash flow and Rs 906.7 crore of total equity in H1 FY27.
powered by IRIS
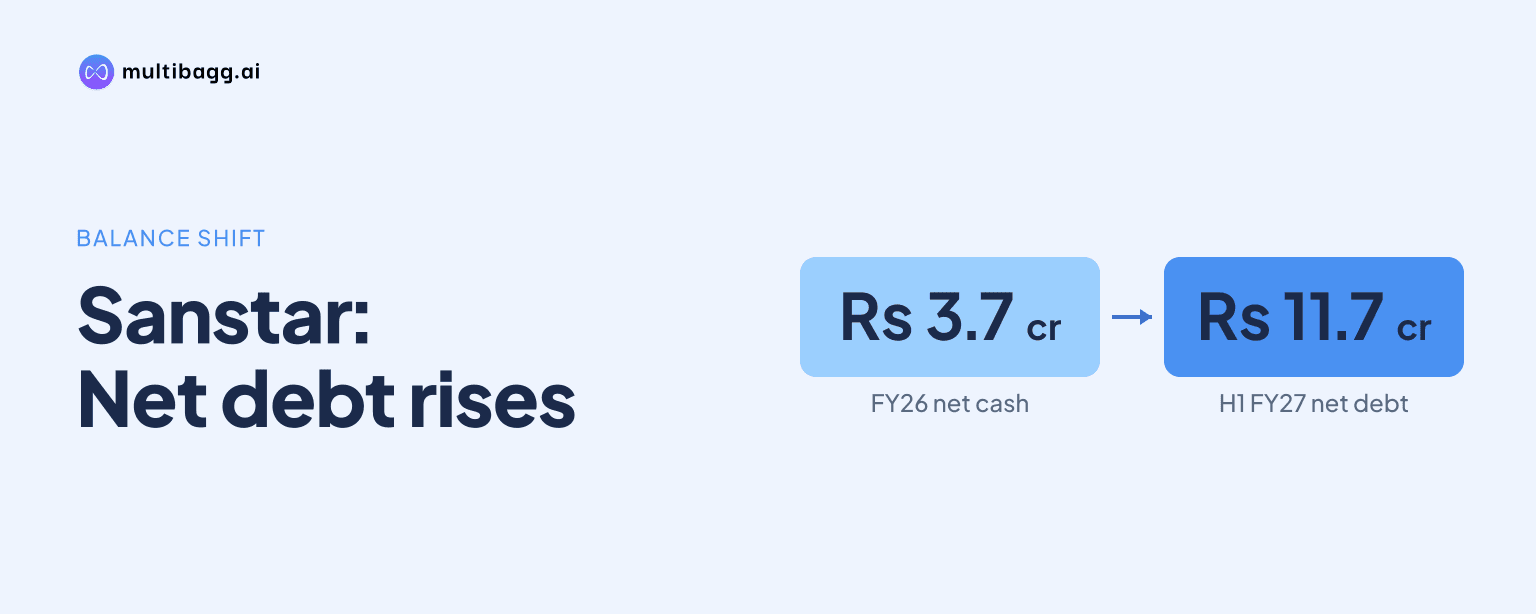
Sanstar Ltd moved from Rs 3.7 crore of net cash at FY26 to Rs 11.7 crore of net debt in H1 FY27 after reporting Rs 204.1 crore of investing cash outflow for capacity expansion and strategic growth initiatives. Total debt reached Rs 30.8 crore, while net debt to equity was reported at 0.01 times.
Know Sanstar inside out
Results, valuation, peers and who's buying, in one view.
What did Sanstar’s H1 FY27 cash flow show?
Sanstar reported Rs 204.1 crore of investing cash outflow in H1 FY27, exceeding its Rs 23.4 crore operating cash inflow and resulting in closing net debt of Rs 11.7 crore. Management described the investing outflow as capacity expansion and strategic growth initiatives, without providing a project-by-project allocation, expected completion date or cost split.
The cash-flow bridge includes a Rs 28.6 crore working-capital change and Rs 2.9 crore of tax paid. It also records Rs 207.7 crore of financing activity and a Rs 10.9 crore change in debt, although the presentation does not detail the composition of the financing activity or explain the relationship between those two lines.
The disclosed investing outflow was about 8.7 times the operating cash inflow for H1 FY27. The comparison indicates that the period’s investment programme was funded alongside financing activity rather than solely by operating cash generation; however, the presentation does not identify whether the financing was equity, borrowing or another source.
How did Sanstar’s debt and cash position change?
Sanstar’s total debt increased to Rs 30.8 crore in H1 FY27 from Rs 19.9 crore at FY26, while cash and cash equivalents used in its net-debt calculation declined to Rs 19.1 crore from Rs 23.6 crore. This changed the reported position from Rs 3.7 crore of net cash to Rs 11.7 crore of net debt.
The change in borrowings was concentrated in short-term debt, which increased to Rs 23.2 crore from Rs 9.9 crore. Long-term debt declined to Rs 7.6 crore from Rs 10 crore, meaning the Rs 10.9 crore rise in total debt reflected the increase in short-term borrowings.
Sanstar reported net debt to equity of 0.01 times in H1 FY27, compared with negative 0.01 times at FY26 and negative 0.14 times in FY25. The negative ratios in the earlier periods reflect net cash under the company’s calculation, whereas the H1 FY27 ratio reflects the move to reported net debt.
Got a follow-up? Ask IRIS
What changed on Sanstar’s balance sheet by September 2026?
Sanstar’s total assets increased to Rs 1,020 crore on 30 September 2026 from Rs 803 crore on 31 March 2026, while shareholders’ funds increased to Rs 906.7 crore from Rs 693.9 crore. Equity share capital rose to Rs 40.1 crore from Rs 36.5 crore and other equity rose to Rs 866.6 crore from Rs 657.5 crore.
Property, plant and equipment rose by Rs 16.5 crore to Rs 440.9 crore, and capital work in progress increased by Rs 16.3 crore to Rs 27.3 crore. Other non-current assets increased to Rs 28.6 crore from Rs 8.1 crore. These asset movements occurred during the same half year as the Rs 204.1 crore investing outflow, but Sanstar does not map the cash-flow spending to specific balance-sheet lines.
Current assets rose to Rs 520.9 crore from Rs 355.3 crore. Inventories increased to Rs 62.6 crore from Rs 42.1 crore, trade receivables rose to Rs 96.9 crore from Rs 94.8 crore, and current investments declined to Rs 11.1 crore from Rs 27.2 crore.
Sanstar’s balance sheet separately lists cash and bank balances of Rs 290.8 crore at 30 September 2026, compared with Rs 133.5 crore at 31 March 2026. That line differs from the Rs 19.1 crore of cash and cash equivalents used in the H1 FY27 net-debt analysis, and the presentation provides no reconciliation between the two measures.
Did Sanstar’s operating performance support H1 FY27 investment?
Sanstar recorded operating revenue of Rs 424.4 crore in H1 FY27, up 15.9% from Rs 366.1 crore in H1 FY26. Earnings before interest, tax, depreciation and amortisation, or EBITDA, excluding other income, rose to Rs 23.7 crore from Rs 0.4 crore, while profit after tax increased to Rs 15.1 crore from Rs 0.3 crore.
Gross profit increased to Rs 139.7 crore from Rs 89.9 crore, and gross margin rose to 32.9% from 24.5%. EBITDA margin increased to 5.6% from 0.1%, while profit after tax margin increased to 3.6% from 0.1%; finance cost declined to Rs 0.9 crore from Rs 1.2 crore.
Quarterly profitability declined sequentially despite higher revenue. Q2 FY27 operating revenue was Rs 218.3 crore, above Rs 206.2 crore in Q1 FY27, but EBITDA excluding other income declined to Rs 8.3 crore from Rs 15.4 crore and profit after tax declined to Rs 5.9 crore from Rs 9.2 crore.
Sanstar identifies products including native maize starch, liquid glucose, maltodextrin, dextrose monohydrate, corn gluten meal and corn fibre across food, personal care, pharmaceuticals and animal nutrition. It does not disclose revenue, margin, capital expenditure or operating cash flow by product category or end-use segment.
Conclusion
Sanstar’s H1 FY27 disclosures show that an expansion-related investment programme coincided with a shift from net cash to net debt. The Rs 204.1 crore investing outflow was substantially higher than Rs 23.4 crore of operating cash flow, while total debt rose to Rs 30.8 crore and equity increased to Rs 906.7 crore.
The next disclosures should clarify the timing and use of expansion expenditure, the composition of Rs 207.7 crore in financing activity and the difference between cash and bank balances and cash equivalents. Management cites capacity expansion and strategic growth initiatives, while its Dhule facility has stated four-times expansion potential and its Kutch site has 42 acres available for future expansion.