










Satia Industries Limited reports Rs 44.6 crore H1 FY27 loss
Key highlights
- SIL reported a Rs 44.6 crore H1 FY27 loss, compared with a Rs 7.1 crore profit in H1 FY26.
- SIL’s H1 FY27 revenue from operations fell 7% year on year to Rs 637.3 crore.
- SIL’s H1 FY27 employee benefit expenses rose 13% to Rs 66.3 crore while total expenses fell 5% to Rs 659.7 crore.
- SIL’s combined long-term and short-term borrowings rose to Rs 344.9 crore at September 2026 from Rs 298.2 crore at March 2026.
powered by IRIS
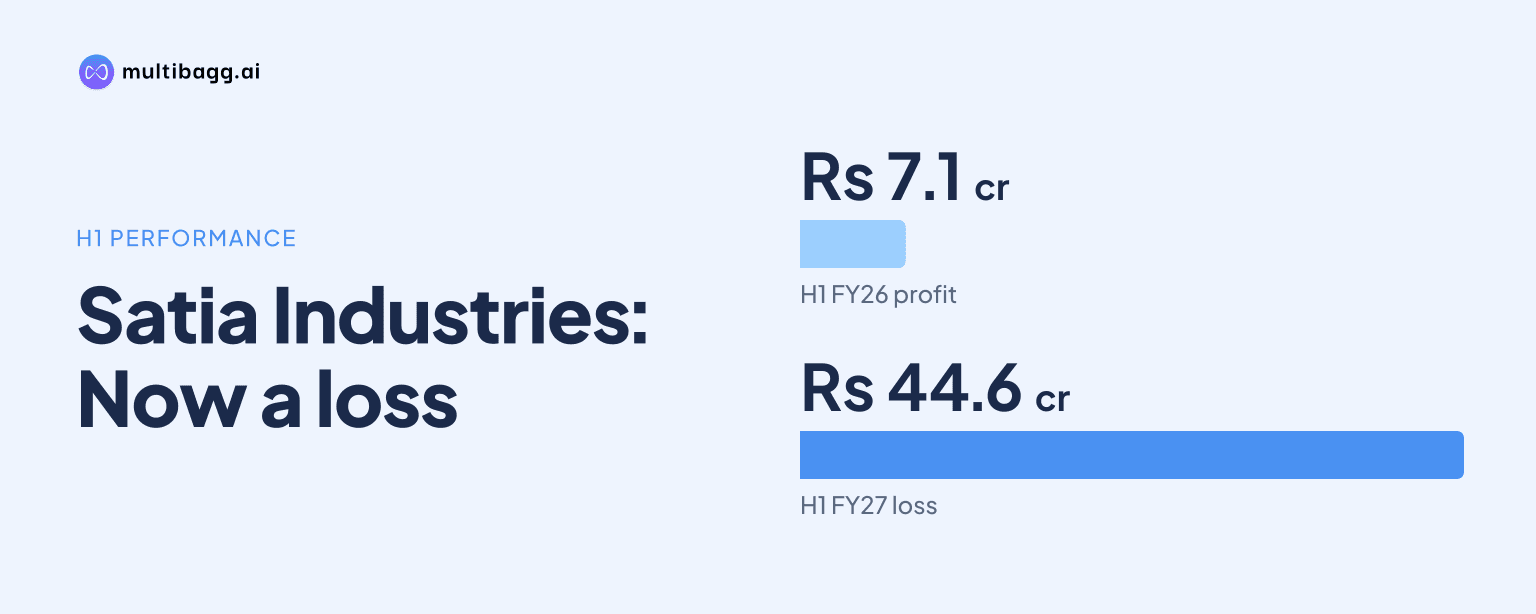
Satia Industries Limited reported a Rs 44.6 crore loss in H1 FY27, reversing a Rs 7.1 crore profit in H1 FY26, as revenue from operations declined 7% year on year to Rs 637.3 crore and total expenses fell by a smaller 5% to Rs 659.7 crore. The half-year result included a Rs 5.1 crore exceptional item.
Know Satia Industries inside out
Results, valuation, peers and who's buying, in one view.
Why did SIL report a loss in H1 FY27?
SIL reported a loss because H1 FY27 total income of Rs 650.2 crore was Rs 9.5 crore below total expenses of Rs 659.7 crore before exceptional items and tax. In H1 FY26, total income was Rs 697.7 crore and expenses were Rs 692.0 crore, resulting in profit before tax and exceptional items of Rs 5.7 crore.
The H1 FY27 loss for the period was Rs 44.6 crore, compared with a Rs 7.1 crore profit a year earlier. Profit before tax was a Rs 14.6 crore loss after the Rs 5.1 crore exceptional item, versus Rs 5.7 crore profit before tax in H1 FY26. Total tax was Rs 30.0 crore in H1 FY27, compared with a Rs 1.4 crore tax credit in the prior-year period.
Earnings per share, not annualised, moved to a loss of Rs 4.46 in H1 FY27 from earnings of Rs 0.71 in H1 FY26. The first half included losses in both quarters: Rs 17.1 crore in Q1 FY27 and Rs 27.5 crore in Q2 FY27. Q2 FY26 had also recorded a Rs 24.5 crore loss.
How have SIL revenue and EBITDA changed?
SIL’s revenue from operations fell to Rs 637.3 crore in H1 FY27 from Rs 682.0 crore in H1 FY26, while earnings before interest, tax, depreciation and amortisation, or EBITDA, was Rs 44.7 crore in H1 FY27. The presentation does not provide H1 FY26 EBITDA, but its annual performance indicators show EBITDA declining in both FY25 and FY26.
Annual income decreased from Rs 1,720.8 crore in FY24 to Rs 1,512.0 crore in FY25 and Rs 1,451.9 crore in FY26. EBITDA fell from Rs 418.7 crore in FY24 to Rs 270.3 crore in FY25 and Rs 131.8 crore in FY26. Profit after tax, or PAT, declined from Rs 211.2 crore in FY24 to Rs 118.6 crore in FY25 and Rs 40.9 crore in FY26 before the H1 FY27 loss.
Revenue weakened during the latest half year. Q2 FY27 revenue from operations was Rs 275.5 crore, down 24% from Rs 361.8 crore in Q1 FY27 and down 11% from Rs 311.1 crore in Q2 FY26. Other income declined to Rs 1.8 crore in Q2 FY27 from Rs 11.1 crore in Q1 FY27 and Rs 9.4 crore a year earlier, taking Q2 total income to Rs 277.3 crore.
Got a follow-up? Ask IRIS
Which SIL costs fell and which increased?
SIL reduced finance cost, depreciation and other expenses in H1 FY27, but cost of goods sold was broadly unchanged and employee benefit expenses increased. Cost of goods sold was Rs 342.7 crore, compared with Rs 341.1 crore in H1 FY26, despite the Rs 44.7 crore decline in revenue from operations. Employee benefit expenses rose 13% to Rs 66.3 crore from Rs 58.9 crore.
Finance cost fell 27% year on year to Rs 7.9 crore from Rs 10.9 crore, while depreciation and amortisation declined 14% to Rs 59.3 crore from Rs 68.9 crore. Other expenses fell 14% to Rs 183.6 crore from Rs 212.3 crore. Total expenses consequently declined Rs 32.3 crore, less than the Rs 47.5 crore fall in total income.
The quarterly figures showed a similar gap between income and costs. Q2 FY27 total income declined 26% sequentially to Rs 277.3 crore from Rs 372.9 crore in Q1 FY27, while total expenses fell 8% to Rs 316.0 crore from Rs 343.8 crore. Cost of goods sold declined 7% to Rs 165.0 crore, but depreciation and amortisation increased 4% to Rs 30.2 crore.
What changed in SIL’s balance sheet by September 2026?
SIL’s total assets were Rs 1,563.3 crore at September 2026, compared with Rs 1,557.8 crore at March 2026, while fixed assets increased to Rs 1,021.1 crore from Rs 947.0 crore. Tangible assets rose to Rs 911.3 crore from Rs 646.0 crore, while capital work in progress declined to Rs 46.6 crore from Rs 256.9 crore.
Current assets fell to Rs 347.2 crore at September 2026 from Rs 388.6 crore at March 2026. Trade receivables declined to Rs 65.5 crore from Rs 128.6 crore, while inventories increased to Rs 181.4 crore from Rs 173.2 crore. Cash and cash equivalents were Rs 3.4 crore, compared with Rs 4.3 crore six months earlier.
Borrowings increased in both reported categories. Long-term borrowings rose to Rs 210.0 crore at September 2026 from Rs 195.8 crore at March 2026, while short-term borrowings increased to Rs 134.9 crore from Rs 102.4 crore. Shareholders’ funds declined to Rs 1,038.4 crore from Rs 1,088.0 crore; the presentation reported net debt-to-equity of 0.25 times for FY26, following 0.14 times in FY25.
Conclusion
SIL’s H1 FY27 result combined a 7% decline in revenue with a 5% reduction in expenses, reversing the prior-year Rs 7.1 crore profit into a Rs 44.6 crore loss. The shift reflected a Rs 9.5 crore operating shortfall before exceptional items and tax, followed by a Rs 5.1 crore exceptional item and Rs 30.0 crore total tax.
The next disclosed operating plan to watch is SIL’s tableware cutlery business. The company said it has 16 total cutlery units, that its old machines are operating at 100% capacity, and that it has scaled inventory for anticipated demand. Its FY26 region-wise sales also showed the North accounting for 58% of sales, making the direction of paper demand in that region relevant to future revenue.