










Shalby Limited September-quarter revenue rises 9.7%, PBT falls 13.6%
Key highlights
- Shalby’s September 2026-quarter revenue from operations rose 9.7% to Rs 313.173 crore.
- Shalby’s September-quarter PBT fell 13.6% to Rs 16.474 crore.
- Healthcare Services revenue rose to Rs 283.208 crore, while implants recorded a Rs 11.638 crore segment loss.
- Shalby generated operating cash flow of Rs 40.096 crore in the half year ended September 30, 2026.
powered by IRIS
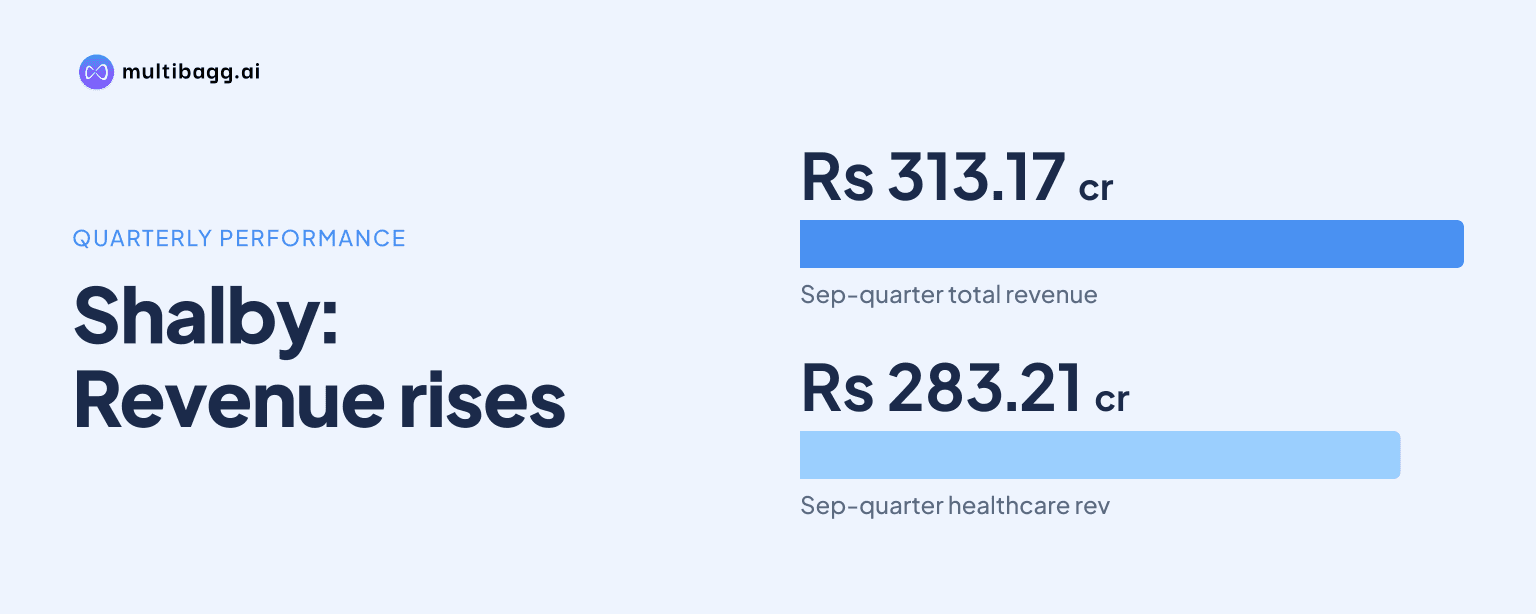
Shalby Limited reported consolidated revenue from operations of Rs 313.173 crore for the quarter ended September 30, 2026, up 9.7% from Rs 285.432 crore a year earlier, but profit before tax (PBT) fell 13.6% to Rs 16.474 crore as the manufacturing and trading of implants segment recorded a Rs 11.638 crore loss.
Know Shalby inside out
Results, valuation, peers and who's buying, in one view.
How did Shalby perform in the September 2026 quarter?
Shalby’s September 2026 quarter combined higher revenue with lower PBT, as total expenses grew faster than revenue. Revenue from operations increased by Rs 27.741 crore year on year, while total income, including other income, rose to Rs 318.216 crore from Rs 289.908 crore. Total expenses rose to Rs 301.742 crore from Rs 270.834 crore, a Rs 30.908 crore increase that exceeded the rise in total income.
The resulting PBT was Rs 16.474 crore, compared with Rs 19.074 crore in the September 2025 quarter. Profit after tax was Rs 7.886 crore, up from Rs 7.278 crore, while profit attributable to shareholders of the group was Rs 8.277 crore against Rs 8.385 crore. Non-controlling interests accounted for a Rs 0.391 crore loss in the latest quarter, compared with a Rs 1.106 crore loss a year before.
On a sequential basis, revenue declined from Rs 331.224 crore in the June 2026 quarter and PBT declined from Rs 19.696 crore. Other income was Rs 5.043 crore in September, below Rs 7.414 crore in June, while total expenses fell from Rs 318.942 crore. Basic and diluted earnings per share were each Rs 0.73, compared with Rs 0.98 in the preceding quarter and Rs 0.68 a year earlier.
Which Shalby segment drove revenue growth?
Healthcare Services drove Shalby’s year-on-year revenue expansion, reporting Rs 283.208 crore for the September 2026 quarter, up from Rs 252.566 crore. The segment added Rs 30.642 crore of revenue and represented the source of growth in the group’s Rs 27.741 crore increase in revenue from operations.
Healthcare Services segment result rose to Rs 28.112 crore from Rs 25.595 crore in the comparable quarter. However, it was lower than Rs 31.176 crore in the June 2026 quarter, when the segment generated Rs 288.814 crore of revenue. The source defines Healthcare Services as setting up and managing hospitals and medical diagnostic services.
Manufacturing and trading of implants reported September-quarter revenue of Rs 29.965 crore, down from Rs 32.866 crore a year earlier and Rs 42.410 crore in June 2026. Its segment loss widened to Rs 11.638 crore from Rs 6.520 crore in the September 2025 quarter, while remaining close to the Rs 11.481 crore loss in the preceding quarter. The source defines this segment as manufacturing and trading of implants.
The segment figures show why revenue growth did not produce higher PBT. The Healthcare Services segment’s Rs 2.517 crore year-on-year improvement in result was outweighed by the Rs 5.118 crore increase in the implants segment loss. Before tax, the consolidated group therefore moved from Rs 19.074 crore of profit in the prior-year quarter to Rs 16.474 crore.
Got a follow-up? Ask IRIS
What costs and half-year trends affected Shalby’s profit?
Higher operating, purchasing and financing costs affected Shalby’s September-quarter profit comparison. Operative expenses rose to Rs 141.208 crore from Rs 128.481 crore, purchases of stock in trade increased to Rs 42.995 crore from Rs 31.214 crore, and finance costs increased to Rs 11.049 crore from Rs 9.645 crore. Employee benefits expense declined to Rs 43.316 crore from Rs 45.206 crore.
For the half year ended September 30, 2026, revenue from operations rose 10.7% to Rs 644.397 crore from Rs 581.859 crore. Yet PBT declined 13.3% to Rs 36.169 crore from Rs 41.727 crore. Profit after tax increased to Rs 18.381 crore from Rs 14.956 crore, while total comprehensive income rose to Rs 15.273 crore from Rs 7.450 crore.
The half-year expense mix also changed. Purchases of stock in trade increased to Rs 85.005 crore from Rs 60.555 crore, while changes in inventories were an expense of Rs 13.585 crore compared with an income effect of Rs 19.238 crore in the prior-year half. Finance costs rose to Rs 21.614 crore from Rs 19.016 crore, and depreciation and amortisation rose to Rs 37.662 crore from Rs 33.892 crore.
Healthcare Services generated Rs 572.022 crore of half-year revenue, compared with Rs 520.929 crore a year earlier, and its segment result was Rs 59.288 crore against Rs 58.163 crore. Manufacturing and trading of implants revenue rose to Rs 72.375 crore from Rs 60.928 crore for the half year, but its loss widened to Rs 23.119 crore from Rs 16.435 crore. This left group PBT below the prior-year level despite the increase in consolidated revenue.
What changed in Shalby’s balance sheet and cash flow?
Shalby’s consolidated total assets stood at Rs 1,856.967 crore on September 30, 2026, compared with Rs 1,839.130 crore on March 31, 2026. Trade receivables increased to Rs 276.576 crore from Rs 228.424 crore, while inventories eased to Rs 374.729 crore from Rs 376.379 crore. Property, plant and equipment was Rs 909.984 crore, down from Rs 922.297 crore at the March year-end.
Total equity increased to Rs 1,022.010 crore from Rs 1,005.693 crore over the same period. Current borrowings rose to Rs 392.385 crore from Rs 386.736 crore, while non-current borrowings decreased to Rs 144.731 crore from Rs 152.882 crore. Cash and cash equivalents were Rs 21.444 crore at September 30, compared with Rs 21.902 crore at March 31.
Operating cash flow was Rs 40.096 crore in the six months ended September 30, 2026, compared with an outflow of Rs 1.3 lakh in the prior-year half. Cash generated from operations was Rs 59.813 crore, but this was reduced by direct taxes paid of Rs 19.716 crore. The group used Rs 10.222 crore in investing activities and Rs 30.332 crore in financing activities during the latest half year.
The unaudited consolidated results cover Shalby and 13 subsidiary companies, including three step-down subsidiaries. T R Chadha & Co LLP issued its review report on November 3, 2026, stating that nothing had come to its attention to indicate that the statement was not prepared in accordance with the applicable accounting standards and disclosure requirements.
Conclusion
Shalby delivered higher September-quarter revenue, led by Healthcare Services, but the rise did not translate into higher PBT. The Rs 30.908 crore year-on-year increase in total expenses exceeded the Rs 28.308 crore increase in total income, while the implants business reported a larger Rs 11.638 crore segment loss. Healthcare Services remained profitable at Rs 28.112 crore, but its result was lower than in the June quarter.
The next disclosed matters to watch are shareholder approvals for the proposed five-year appointment of Shanay Vikram Shah as whole-time director and the five-year appointment of Tushar Shah as executive director. Shalby’s board recommended or approved these appointments on November 3, 2026, subject to shareholder approval.