










SMT cuts cash cycle to 128 days, but H1 free cash flow is negative
Key highlights
- SMT's cash-conversion cycle declined to 128 days in H1 FY27 from 144 days in FY25.
- Receivable days and inventory days each declined by 8 days from FY26 to H1 FY27.
- SMT generated Rs 47.3 crore of operating cash flow in H1 FY27, equal to 41% of EBITDA.
- Free cash flow after leases before interest was negative Rs 1.8 crore in H1 FY27.
powered by IRIS
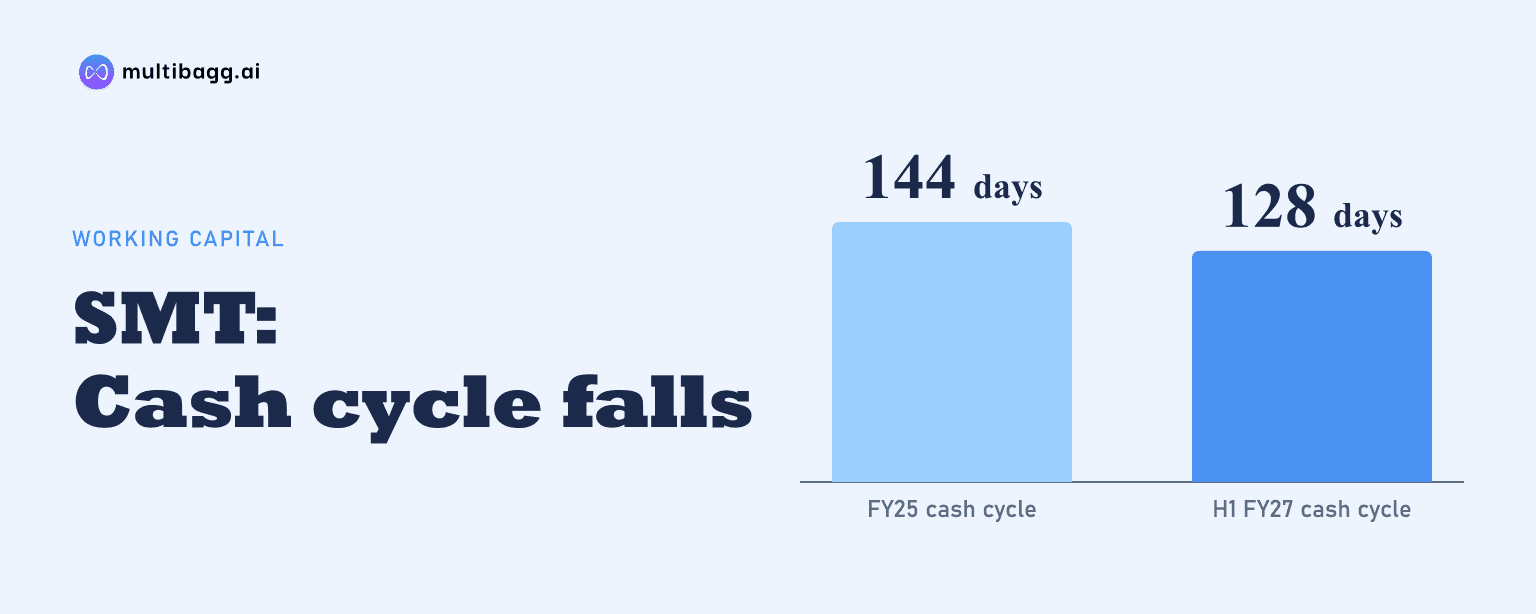
SMT reduced its cash-conversion cycle to 128 days in H1 FY27, 16 days below FY25, but reported negative Rs 1.8 crore of free cash flow after leases before interest as Rs 41.5 crore of net capital expenditure and Rs 7.6 crore of lease payments exceeded Rs 47.3 crore of operating cash flow.
Know Sahajanand Medical Technologies inside out
Results, valuation, peers and who's buying, in one view.
How did SMT reduce its cash-conversion cycle to 128 days?
SMT reduced its cash-conversion cycle, or CCC, to 128 days in H1 FY27 from 144 days in FY25 and 138 days in FY26. The 16-day reduction from FY25 consisted of lower receivable and inventory days, partly offset by fewer payable days, which represent the period of supplier credit available to the company.
Receivable days declined to 75 in H1 FY27 from 85 in FY25 and 83 in FY26. Inventory days fell to 79 from 92 in FY25 and 87 in FY26. From FY26 to H1 FY27, faster collections and lower inventory each reduced the cycle by eight days.
Payable days declined to 26 in H1 FY27 from 33 in FY25 and 32 in FY26. This six-day reduction in supplier-credit days partly offset the lower receivable and inventory days, resulting in a 10-day CCC reduction from FY26 to H1 FY27.
What happened to SMT's operating cash generation in H1 FY27?
SMT generated Rs 47.3 crore of cash from operations in H1 FY27, equal to 41% of earnings before interest, tax, depreciation and amortisation, or EBITDA, of Rs 114.1 crore. The H1 conversion rate was below the 62% reported for FY26, although H1 FY27 covers six months and FY26 covers a full year.
Cash from operations increased across the three completed financial years shown, rising from Rs 41.1 crore in FY24 to Rs 73.5 crore in FY25 and Rs 105.2 crore in FY26. The FY26 amount was about 2.6 times FY24 cash from operations, while EBITDA increased from Rs 110 crore in FY24 to Rs 170.7 crore in FY26.
SMT reported H1 FY27 revenue from operations of Rs 725.1 crore, up 24.9% year on year, and EBITDA of Rs 114.1 crore, up 43.4%. EBITDA margin rose to 15.7% from 13.7% in H1 FY26, while the presentation does not provide a line-by-line reconciliation for the H1 operating-cash-flow movement.
Got a follow-up? Ask IRIS
Why was SMT's H1 FY27 free cash flow negative?
SMT reported negative Rs 1.8 crore of free cash flow after leases before interest on borrowings in H1 FY27 because its Rs 47.3 crore of operating cash flow did not cover Rs 41.5 crore of net capital expenditure and Rs 7.6 crore of lease payments. The company presents this measure before interest on borrowings.
Net capital expenditure absorbed about 88% of H1 operating cash flow, and lease payments represented a further 16%. Together, these two outflows totalled Rs 49.1 crore, exceeding operating cash flow by Rs 1.8 crore.
The H1 FY27 outcome followed positive free cash flow after leases before interest of Rs 16.4 crore in FY25 and Rs 1.6 crore in FY26. The same measure was negative Rs 9.8 crore in FY24, when Rs 41.1 crore of operating cash flow was offset by Rs 39.3 crore of net capital expenditure and Rs 11.6 crore of lease payments.
How did SMT's working capital and debt change in H1 FY27?
SMT's net working capital rose to Rs 500.3 crore at 30 September 2026 from Rs 428.5 crore at 31 March 2026, an increase of Rs 71.8 crore. The increase in the rupee balance occurred alongside the decline in CCC days during H1 FY27.
Inventory at cost rose by Rs 21.2 crore to Rs 330.3 crore, while trade receivables increased by Rs 31.8 crore to Rs 318.1 crore. Trade payables and other current liabilities, net of assets, changed to negative Rs 148.1 crore from negative Rs 166.9 crore, a Rs 18.8 crore reduction in net current liabilities.
Capital employed increased to Rs 932.7 crore from Rs 860.2 crore, while total equity increased to Rs 745.3 crore from Rs 702.3 crore. SMT reported annualised return on capital employed of 16.7% at September 2026, calculated using H1 FY27 earnings before interest and tax multiplied by two.
SMT's period-end net debt rose to Rs 223.5 crore in H1 FY27 from Rs 191.1 crore at FY26. Reported net debt to EBITDA declined to 0.98 times from 1.12 times, with the H1 FY27 ratio using annualised EBITDA of Rs 114.1 crore for the six-month period.
Conclusion
SMT's H1 FY27 figures show that its 128-day cash-conversion cycle was 16 days below FY25, supported by lower receivable and inventory days. However, operating cash flow of Rs 47.3 crore converted 41% of EBITDA and did not cover Rs 49.1 crore of net capital expenditure and lease payments, resulting in negative Rs 1.8 crore of free cash flow after leases before interest.
The next disclosed measures to watch are receivable days, inventory days and capital expenditure relative to operating cash flow. SMT also reported net debt of Rs 223.5 crore at 30 September 2026, while its 0.98-times net-debt-to-EBITDA ratio is based on annualised H1 FY27 EBITDA rather than a completed full-year EBITDA figure.