










SMT Q2 revenue reaches Rs 373.4 crore, EBITDA margin 17.6%
Key highlights
- SMT reported record Q2 FY27 revenue of Rs 373.4 crore, up 24.7% year on year.
- Q2 FY27 EBITDA rose 36.6% to Rs 65.6 crore and the margin reached 17.6% from 16.0%.
- Other Trading products grew 62.1% in Q2 FY27 and represented 26.1% of revenue.
- RoW generated Rs 290.4 crore, or 40.0% of H1 FY27 revenue, after 37.1% growth.
powered by IRIS
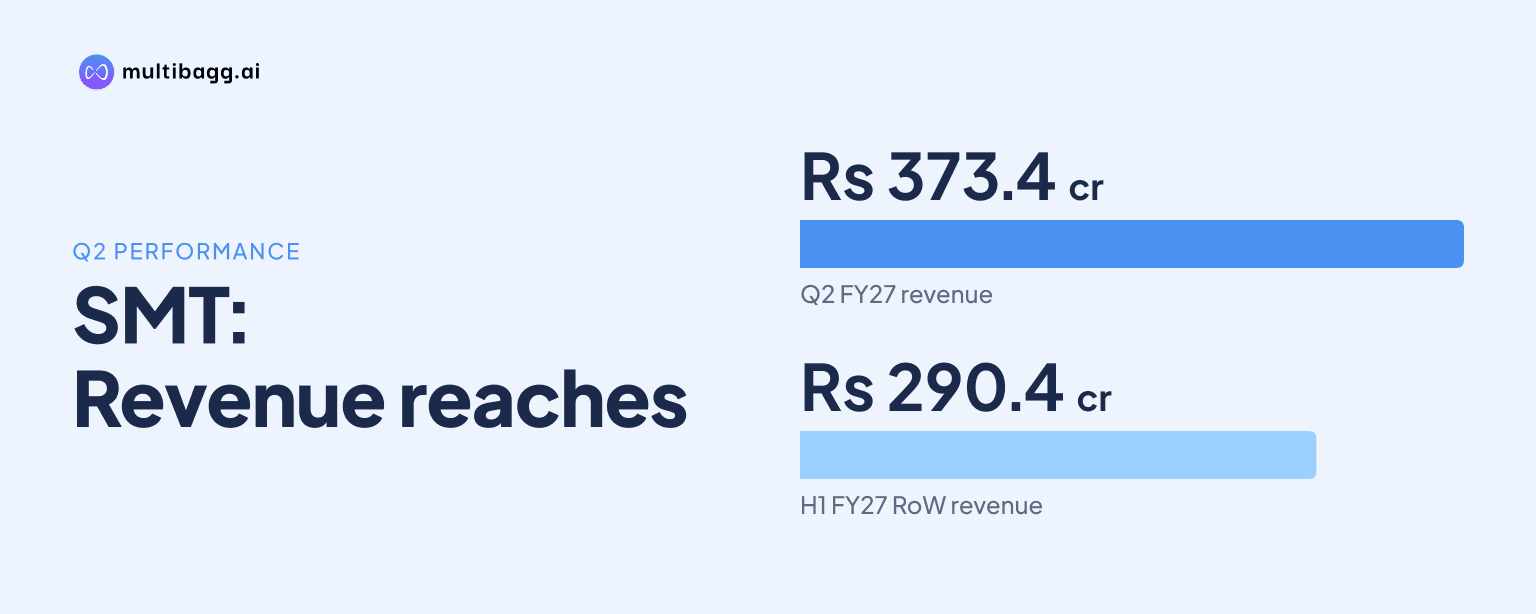
SMT reported record Q2 FY27 revenue of Rs 373.4 crore, up 24.7% year on year, and EBITDA of Rs 65.6 crore, up 36.6%, lifting EBITDA margin to 17.6% from 16.0%. The result was SMT’s first reported quarter after its 23 October 2026 listing and included a 197-basis-point decline in gross margin.
Know Sahajanand Medical Technologies inside out
Results, valuation, peers and who's buying, in one view.
How did SMT deliver record Q2 FY27 earnings?
SMT delivered its highest quarterly revenue, EBITDA and profit after tax in Q2 FY27. Revenue from operations increased to Rs 373.4 crore from Rs 299.5 crore in Q2 FY26, while EBITDA rose to Rs 65.6 crore from Rs 48 crore and profit after tax increased to Rs 26.5 crore from Rs 20.9 crore. Profit before tax rose 47.9% to Rs 40.1 crore, while tax expense increased to Rs 13.6 crore from Rs 6.2 crore.
SMT’s Q2 EBITDA margin expanded by 154 basis points to 17.6%, while profit after tax margin was 7.1%, compared with 7.0% a year earlier. In H1 FY27, revenue rose 24.9% to Rs 725.1 crore and EBITDA increased 43.4% to Rs 114.1 crore, producing a 15.7% margin versus 13.7% in H1 FY26. Reported H1 profit after tax rose 7.5% to Rs 41.6 crore, while profit after tax excluding an earlier-period tax credit in H1 FY26 increased 38.8% from Rs 29.9 crore.
Why did SMT's EBITDA margin rise as gross margin fell?
SMT’s EBITDA margin rose because employee benefits and other expenses fell as proportions of revenue by more than gross margin declined. Q2 gross margin fell to 74.4% from 76.4%, as cost of goods sold increased to Rs 95.6 crore from Rs 70.8 crore. Gross profit nevertheless rose 21.5% to Rs 277.8 crore as revenue grew 24.7%.
Employee benefits expense represented 27.1% of Q2 revenue, down from 28.8% in Q2 FY26, while other expenses fell to 29.7% from 31.5%. In absolute terms, employee costs rose to Rs 101.3 crore from Rs 86.3 crore and other expenses reached Rs 111 crore from Rs 94.5 crore, but both grew more slowly than sales. For H1 FY27, gross margin declined 170 basis points to 74.3%, while employee benefits and other expenses declined by 226 basis points and 146 basis points, respectively, as shares of revenue.
SMT reported constant-currency revenue growth of about 16% in Q2 FY27, against reported growth of 24.7%, and about 15% in H1 FY27, against 24.9% reported growth. Management said its margin priorities include a richer product mix, vertical integration of critical components, better plant utilisation and tighter overhead control. The presentation does not quantify the contribution of any individual initiative or currency movement to the margin change.
Got a follow-up? Ask IRIS
Which products drove SMT's Q2 FY27 growth?
SMT’s Other Trading products were the fastest-growing category in Q2 FY27, with revenue up 62.1% year on year and a 26.1% revenue mix. Management attributed growth in this category to intravascular ultrasound, or IVUS. The category had grown 41.7% in Q1 FY27, indicating faster growth in the second quarter.
Structural heart, or SH, transcatheter aortic valve implantation, or TAVI, and occluder products grew 39.7% in Q2, compared with 10.3% in Q1, and their mix rose to 18.3% from 16.0%. Vascular intervention, or VI, stents and balloons remained the largest category at 55.7% of Q2 revenue, although its growth was 9.1%. For H1 FY27, VI accounted for 57.9% of revenue and grew 16.1%, while SH accounted for 17.2% and grew 24.7%, and Other Trading represented 24.9% and grew 52.0%.
SMT also said Sironity, its sirolimus drug-coated balloon, is commercialised in India. Its TAVI platform progressed with Hydra Elevate and a redesigned AVDC 1.5 delivery system. The presentation does not disclose separate revenue for Sironity, Hydra Elevate or AVDC 1.5.
Which markets contributed most to SMT's H1 FY27 revenue?
SMT’s Rest of World, or RoW, region was its largest H1 FY27 market, generating Rs 290.4 crore, or 40.0% of revenue, after 37.1% year-on-year growth. RoW revenue rose 32.4% to Rs 154.5 crore in Q2 FY27 following 42.8% growth to Rs 135.9 crore in Q1. The presentation identifies RoW as comprising APAC, RCIS, LATAM and MEA.
Europe generated Rs 262.7 crore in H1 FY27, or 36.2% of revenue, and grew 23.4%. Its Q2 revenue of Rs 130.7 crore was slightly below Q1 revenue of Rs 132 crore, although growth was about 23% in both quarters. India generated Rs 172 crore, or 23.7% of H1 revenue, and grew 10.4%; its Q2 growth accelerated to 14.8% from 6.2% in Q1. India’s lower revenue share reflected faster expansion in RoW and Europe.
How did SMT's cash conversion and returns change?
SMT’s cash conversion cycle declined to 128 days in H1 FY27 from 138 days in FY26 and 144 days in FY25. Receivable days fell to 75 from 83 in FY26, and inventory days fell to 79 from 87, while payable days decreased to 26 from 32. Cash from operations was Rs 47.3 crore in H1 FY27, equivalent to 41% of EBITDA, compared with 62% for FY26.
Annualised return on capital employed was 16.7% at 30 September 2026, compared with 12.2% at 31 March 2026, while annualised return on equity was 11.2%, compared with 9.8%. SMT annualised the September measures using H1 FY27 earnings. Capital employed rose to Rs 932.7 crore from Rs 860.2 crore, while net working capital increased to Rs 500.3 crore from Rs 428.5 crore. Free cash flow after leases and before interest was negative Rs 1.8 crore in H1 FY27 after Rs 41.5 crore of net capital expenditure.
Conclusion
SMT’s Q2 FY27 performance combined 24.7% revenue growth with 36.6% EBITDA growth, despite a lower gross margin. The reported expense ratios show that slower growth in employee benefits and other expenses offset the gross-margin decline, while Other Trading products, SH products and RoW grew faster than VI products and India.
The next areas to watch are management’s execution on product mix, vertical integration, plant utilisation and overhead control, alongside cash conversion after negative Rs 1.8 crore of H1 free cash flow after leases and before interest. SMT also said amortisation of acquisition-related intangibles will be fully completed by March 2027, after which the charge will largely cease.