










SMT’s Telangana Plant Holds 56% of Assets, Uses 33% Area
Key highlights
- SMT’s Telangana plant held 56% of FY26 gross block, while 33% of its area was in use.
- Telangana DES capacity increased from 120,000 units per annum in FY26 to 180,000 in H1 FY27.
- Telangana DES utilisation fell to 20% in H1 FY27 from 64% in FY26.
- SMT’s post-Telangana GTFAT averaged 3.7x in FY23 to FY26 versus 7.2x in FY20 to FY22.
powered by IRIS
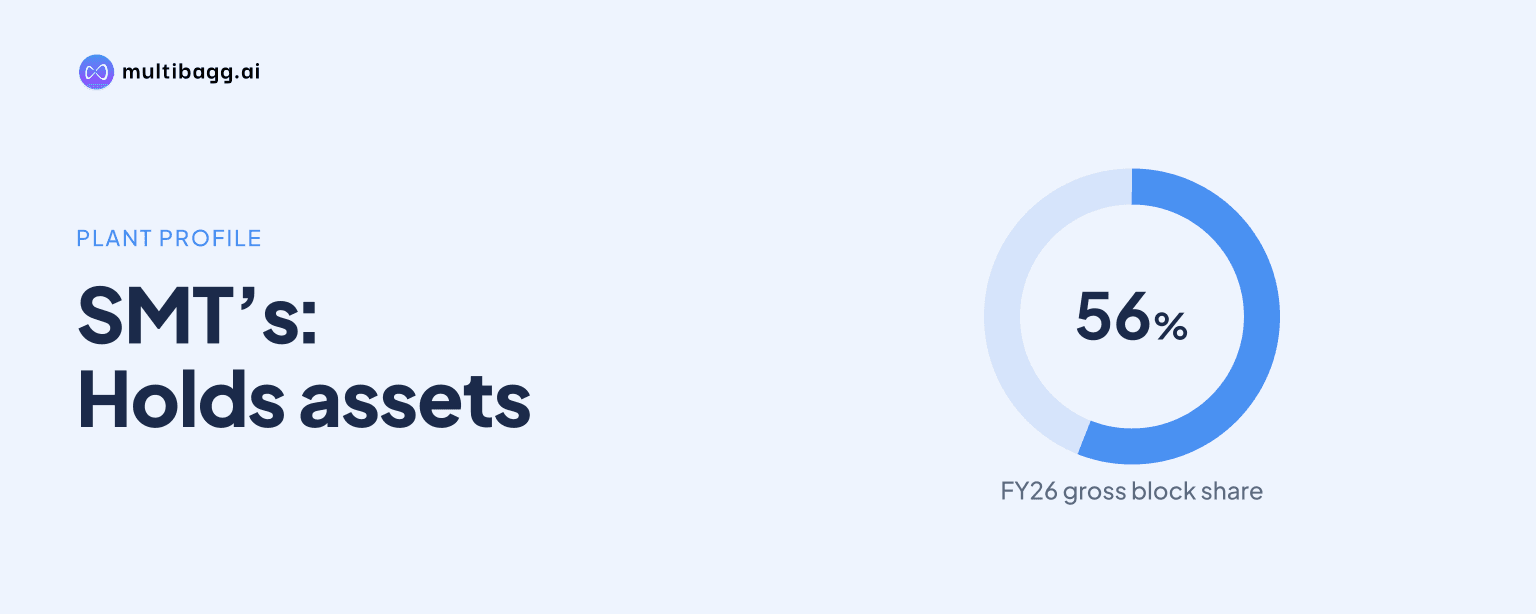
SMT’s Telangana plant accounted for 56% of gross block in FY26 while only 33% of its area was in use, and gross tangible fixed asset turnover averaged 3.7x in FY23 to FY26, versus 7.2x before the plant came on stream.
Know Sahajanand Medical Technologies inside out
Results, valuation, peers and who's buying, in one view.
How much of SMT’s asset base is at the Telangana plant?
SMT reports that 56% of its FY26 gross block was located at the Telangana plant, while 33% of the plant area was in use. The same disclosure shows different utilisation levels by product: drug-eluting stent, or DES, capacity was 64% utilised and catheter capacity was 85% utilised in FY26.
The figures separate physical-area use from production-capacity use. A third of the Telangana site’s area was being used in FY26, but the active DES and catheter lines were running at 64% and 85%, respectively. SMT therefore disclosed both unused site area and product-specific capacity that was operating at higher rates.
The concentration of gross block at one location is notable alongside the pre- and post-commissioning asset-turnover record. Before Telangana came on stream, SMT’s gross tangible fixed asset turnover ratio, or GTFAT, averaged 7.2x across FY20 to FY22. In FY23 to FY26, after the plant came on stream, the average was 3.7x.
How did Telangana capacity and utilisation change in H1 FY27?
SMT increased installed annual DES capacity at Telangana to 180,000 units in H1 FY27 from 120,000 units in FY26, while utilisation fell to 20% from 64%. Telangana percutaneous transluminal coronary angioplasty, or PTCA, balloon capacity rose to 600,000 units per annum from 480,000, and utilisation declined to 57% from 85%.
The H1 FY27 utilisation figures use SMT’s stated methodology. Capacity utilisation equals production divided by installed capacity for the period, and SMT uses half of annual capacity for the six-month H1 FY27 period. The lower percentages followed a period in which SMT added capacity and measured output against the applicable half-year capacity base.
The comparison shows that Telangana’s DES annual capacity increased by 60,000 units and PTCA balloon capacity by 120,000 units between FY26 and H1 FY27. At the same time, disclosed utilisation was 44 percentage points lower for DES and 28 percentage points lower for PTCA balloons.
How far has SMT’s fixed-asset turnover changed since Telangana came on stream?
SMT’s GTFAT declined from a pre-Telangana average of 7.2x in FY20 to FY22 to a post-Telangana average of 3.7x in FY23 to FY26. GTFAT was 4.4x in FY23, then stood at 3.4x in FY24, 3.5x in FY25 and 3.4x in FY26.
The pre-Telangana series also declined before the new facility: GTFAT was 7.8x in FY20, 7.4x in FY21 and 6.5x in FY22. However, SMT’s before-and-after grouping places the ratio at a lower level after Telangana came on stream, with the FY23-to-FY26 average below the FY20-to-FY22 average.
SMT reports H1 FY27 GTFAT of 3.4x, unchanged from FY26. That half-year value is annualised using H1 FY27 revenue multiplied by two, rather than being a reported full-year turnover ratio. The annualised 3.4x result also matches FY24 and remains below FY20’s 7.8x.
Got a follow-up? Ask IRIS
Which other SMT plants show available or heavily used capacity?
SMT’s Surat DES plant was operating at 79% utilisation in H1 FY27 on annual capacity of 780,000 units, compared with 80% in FY26 on the same 780,000-unit capacity. This contrasts with Telangana DES utilisation of 20% in H1 FY27 after that plant’s capacity increased to 180,000 units.
For balloons, Surat’s PTCA line had 660,000 units of annual capacity in both FY26 and H1 FY27, with utilisation falling to 72% from 97%. SMT also introduced a new drug-coated balloon, or DCB, line in Surat with annual capacity of 56,000 units in H1 FY27; its utilisation was 40% during the period.
Outside India, SMT’s Thailand transcatheter aortic valve implantation, or TAVI, capacity increased to 3,600 units per annum in H1 FY27 from 3,000 units in FY26, while utilisation moved to 53% from 60%. Thailand occluder capacity remained 30,000 units annually, and utilisation edged down to 46% from 48%.
What does SMT’s utilisation disclosure indicate about manufacturing headroom?
SMT’s disclosure shows that capacity additions were made at Telangana and Surat in H1 FY27 while several lines were not fully utilised. The clearest example is Telangana DES, where annual capacity reached 180,000 units and utilisation was 20%; the site also had only 33% of its area in use in FY26.
The manufacturing picture is not uniform across products. Telangana catheter capacity was 85% utilised in FY26, Surat PTCA balloon capacity was 97% utilised in FY26, and Surat DES was 79% utilised in H1 FY27. In contrast, the new Surat DCB line was at 40%, Thailand occluders were at 46%, and Telangana DES was at 20% in H1 FY27.
SMT had commercial presence in 70 countries in H1 FY27, compared with 77 in FY26 and 75 in each of FY24 and FY25. SMT cautions that the H1 FY27 count is not directly comparable with full-year counts because it represents countries with at least one product in the period. That qualification limits conclusions from the country count, while the plant data provide the direct record of capacity and utilisation.
Conclusion
SMT’s FY26 disclosure places more than half of gross block at Telangana even though one-third of the plant area was in use. Capacity additions then lifted Telangana’s DES and PTCA balloon capacity in H1 FY27, while their reported utilisation percentages declined. Alongside this manufacturing profile, GTFAT remained at 3.4x in FY26 and on the annualised H1 FY27 basis, below the 7.2x pre-Telangana average.
The presentation frames Telangana capacity as being in place for growth. The next utilisation disclosure will show whether production at the 180,000-unit Telangana DES line and the 600,000-unit Telangana PTCA balloon line rises from H1 FY27 levels of 20% and 57%, and whether that is accompanied by a change in the 3.4x GTFAT ratio.