










Solex targets Rs 4,500 crore FY28E revenue, 5-6% PAT margin
Key highlights
- Solex lists aspirational FY28E revenue of Rs 4,500 crore, compared with Rs 1,618.1 crore for FY26.
- Solex’s FY28E PAT aspiration is Rs 225 crore to Rs 270 crore with a stated 5-6% margin.
- Solex reported H1 FY27 revenue of Rs 539.9 crore, up 29.9% year on year.
- Solex’s Vision 2030 roadmap includes 10 GW each of module, cell and BESS capacity.
powered by IRIS
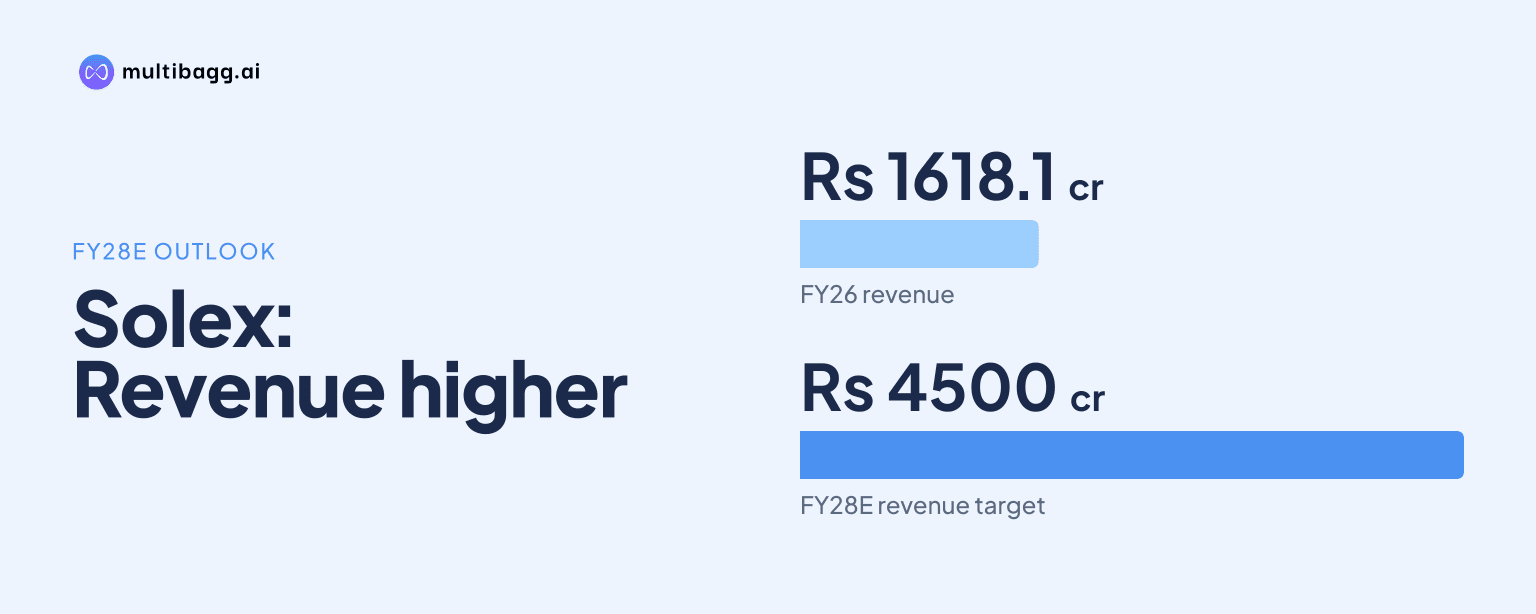
Solex Energy, referred to here as Solex, is targeting Rs 4,500 crore of FY28E revenue and Rs 225 crore to Rs 270 crore of profit after tax, with a stated 5-6% margin, after listing Rs 1,618.1 crore of revenue for FY26.
Know Solex Energy inside out
Results, valuation, peers and who's buying, in one view.
What is Solex targeting for FY28E?
Solex is targeting Rs 4,500 crore of revenue and Rs 225 crore to Rs 270 crore of profit after tax, or PAT, in FY28E. The presentation describes the revenue, PAT and margin figures as aspirational, rather than as reported financial results. Its FY28E PAT target is paired with an explicitly stated PAT margin of 5-6%.
The four-year roadmap lists revenue of Rs 662.2 crore in FY25, Rs 1,618.1 crore in FY26, Rs 2,600 crore in FY27E and Rs 4,500 crore in FY28E. PAT is shown at Rs 42.2 crore in FY25, Rs 98.3 crore in FY26 and Rs 126.4 crore in FY27E before the FY28E range. FY28E denotes the company’s estimate for the fiscal year.
The presentation headline calls the FY28E revenue objective approximately threefold topline growth. That description aligns most closely with the increase from Rs 1,618.1 crore in FY26 to Rs 4,500 crore in FY28E. The material does not disclose pricing, volume, product-mix or utilisation assumptions behind the revenue sequence.
How does the FY28E goal compare with the earlier roadmap?
Solex’s FY28E revenue target is Rs 2,881.9 crore above the Rs 1,618.1 crore listed for FY26 and Rs 1,900 crore above the Rs 2,600 crore listed for FY27E. The FY26-to-FY28E change is about 2.8 times, while the FY27E-to-FY28E step is the largest absolute increase in the displayed plan.
Revenue rises by Rs 955.9 crore from FY25 to FY26 and by Rs 981.9 crore from FY26 to FY27E. The proposed Rs 1,900 crore rise in the final year is therefore nearly twice the increase shown for either of the preceding annual steps. The presentation says Solex is positioned to address an increasing demand-supply gap through timely capacity expansions, but it does not quantify that gap.
The PAT sequence changes at a different pace from revenue. PAT increases by Rs 56.1 crore from FY25 to FY26, then by Rs 28.1 crore to Rs 126.4 crore in FY27E; the FY28E range implies a further increase of Rs 98.6 crore to Rs 143.6 crore. The stated 5-6% PAT margin provides the disclosed profitability parameter for the Rs 4,500 crore revenue target.
Got a follow-up? Ask IRIS
What capacity plan is intended to support Solex’s growth?
Solex’s Vision 2030 roadmap calls for 10 gigawatts, or GW, each of solar module manufacturing, solar cell manufacturing and battery energy storage systems, or BESS, alongside 2 GW of ingot and wafer manufacturing. The roadmap is framed as an integrated energy ecosystem and extends beyond the FY28E revenue period.
Management says it plans to transition from a module manufacturer to an end-to-end energy solutions provider. Its stated strategic pillars include backward integration to secure supply chains and improve margins, technology work on TOPCon, rear-contact and next-generation cell technologies, and expansion across developed and emerging markets.
The 2030 plan does not specify how much of the 10 GW module, 10 GW cell, 10 GW BESS or 2 GW ingot-and-wafer capacity will be operational by FY28E. It also does not disclose a split between domestic and overseas markets, commissioning dates, investment phasing or revenue contributions for these capacity categories.
What do reported H1 FY27 results show about the backdrop?
Solex reported total revenue of Rs 539.9 crore in H1 FY27, up 29.9% from Rs 415.7 crore in H1 FY26. In Q2FY27, total revenue was Rs 274.3 crore, up 3.3% from Rs 265.6 crore in Q1FY27 and 77.4% from Rs 154.6 crore in Q2FY26. These reported interim results are separate from the aspirational full-year FY27E and FY28E roadmap figures.
Earnings before interest, tax, depreciation and amortisation, or EBITDA, was Rs 62.2 crore in H1 FY27, compared with Rs 60.9 crore in H1 FY26. The EBITDA margin declined to 11.7% from 14.7% over the same periods. In Q2FY27, EBITDA was Rs 28.4 crore, below Rs 33.8 crore in Q1FY27, while the margin declined to 10.4% from 13.0%.
Net income after tax was Rs 12.1 crore in H1 FY27, down from Rs 30.5 crore in H1 FY26, and the net margin was 2.3% versus 7.4%. Finance cost rose to Rs 25.7 crore from Rs 11.3 crore, while depreciation and amortisation increased to Rs 20.8 crore from Rs 8.7 crore. These movements coincided with a 60.2% year-on-year decline in H1 FY27 net income after tax.
Solex reported total borrowings of Rs 346.2 crore at H1 FY27, comprising Rs 164.8 crore of non-current borrowings and Rs 181.4 crore of current borrowings. This was up from Rs 269.3 crore at FY26. Plant, property and equipment was Rs 279.1 crore at H1 FY27 versus Rs 273.9 crore at FY26, while inventories increased to Rs 434 crore from Rs 290.5 crore.
Conclusion
Solex’s disclosed FY28E aspiration combines Rs 4,500 crore of revenue with Rs 225 crore to Rs 270 crore of PAT and a 5-6% PAT margin. The plan requires the largest revenue addition in its displayed FY25-to-FY28E sequence, while reported H1 FY27 revenue rose year on year but EBITDA and net margins were below the prior-year half.
The next disclosed benchmark is the Vision 2030 capacity roadmap of 10 GW each for modules, cells and BESS, plus 2 GW for ingots and wafers. What remains unresolved in the presentation is the timing, financing and FY28E operating contribution of those expansions, as well as the underlying sales and pricing assumptions supporting the revenue target.