










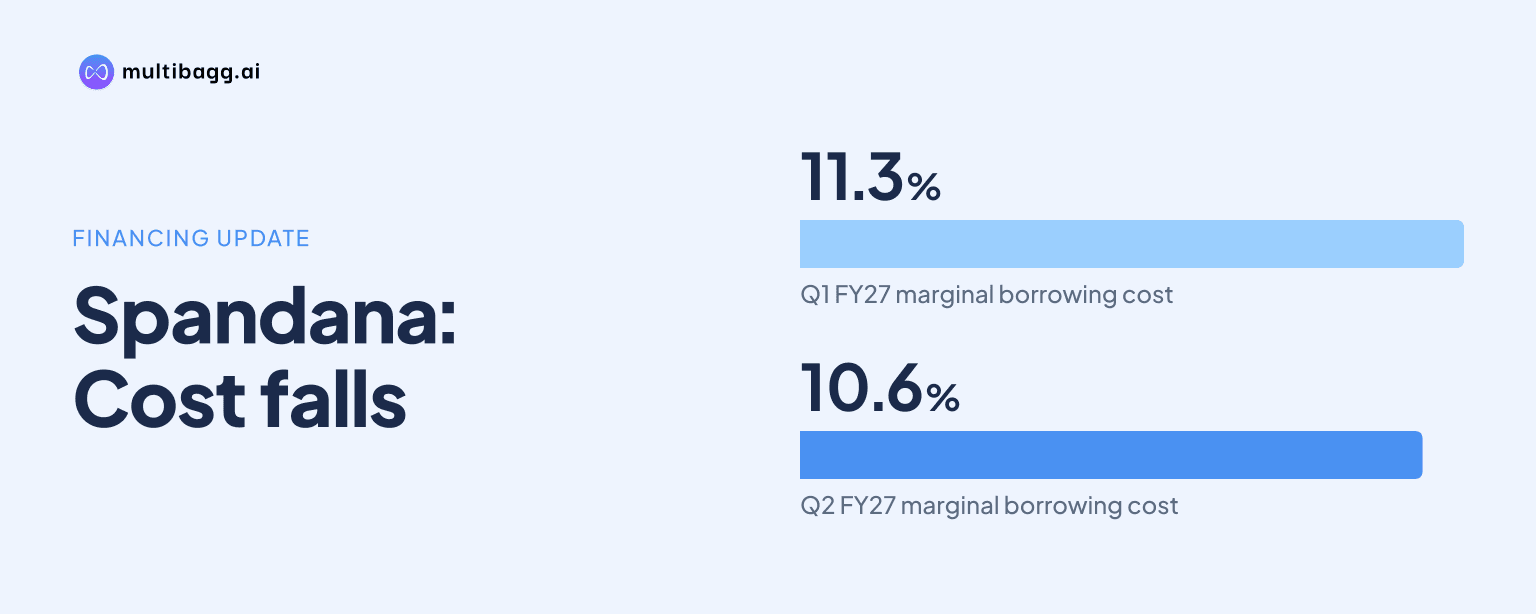
Spandana marginal borrowing cost falls to 10.6% in Q2FY27
Key highlights
- Spandana’s marginal borrowing cost fell to 10.6% in Q2FY27 from 11.3% in Q1FY27 and 13.2% in Q3FY26.
- Banks accounted for 57% of Spandana’s Rs 4,724 crore of borrowings outstanding at September 2026.
- Spandana reported Rs 1,379 crore of liquidity and consolidated CRAR of 33.5% at September 2026.
- Q2FY27 net interest margin increased to 13.6% from 12.5% in Q1FY27, while consolidated gross NPA declined to 2.54% from 3.64%.
powered by IRIS
Spandana Sphoorty Financial Limited reduced its marginal cost of borrowing to 10.6% in Q2FY27 from 13.2% in Q3FY26, a decline of about 260 basis points. Spandana also reported banks at 57% of Rs 4,724 crore of borrowings outstanding, liquidity of Rs 1,379 crore and consolidated CRAR of 33.5% at September 2026.
Know Spandana Sphoorty Financial inside out
Results, valuation, peers and who's buying, in one view.
How much did Spandana's marginal borrowing cost decline?
Spandana's marginal cost of borrowing declined to 10.6% in Q2FY27, from 11.3% in Q1FY27 and 13.2% in Q3FY26. The Q2FY27 figure was 70 basis points lower quarter on quarter and about 260 basis points below the Q3FY26 level. Spandana defines marginal cost of borrowing using XIRR, or extended internal rate of return, inclusive of costs on borrowings availed during the period.
The reported cost of borrowing also declined, to 12.3% in Q2FY27 from 12.8% in Q1FY27. That followed an increase to 13.2% in Q4FY26 from 12.6% in Q3FY26. The marginal rate was below the reported cost of borrowing in both Q1FY27 and Q2FY27.
Spandana raised Rs 1,427 crore of incremental borrowings in Q2FY27, after Rs 1,597 crore in Q1FY27. Incremental borrowing for H1FY27 was Rs 3,024 crore, compared with Rs 160 crore in H1FY26. Separately, the company reported Rs 1,622 crore of equity and debt funds raised in Q2FY27.
Where did Spandana source its borrowings?
Banks were Spandana's largest funding source at September 2026, accounting for 57% of Rs 4,724 crore of borrowings outstanding. Their share increased from 47% at June 2026 and 48% at September 2025. Borrowings outstanding rose by Rs 433 crore during Q2FY27, from Rs 4,291 crore in June 2026.
Capital markets accounted for 23% of the September 2026 borrowing mix, down from 31% in June 2026 and 29% in September 2025. Non-banking financial companies accounted for 20%, compared with 21% three months earlier and 18% one year earlier. Foreign portfolio investor funding was shown at 1% in June 2026 but was not shown in the September 2026 mix.
Of the Rs 1,622 crore of Q2FY27 equity and debt funds raised, Spandana reported Rs 995 crore drawn under CGS at 10.3% pricing and non-CGS borrowing at 10.8%. The company also reported Rs 200 crore raised from the balance on partly paid shares. These funding flows accompanied the shift in the borrowing mix toward banks during the quarter.
What liquidity and capital levels did Spandana report?
Spandana reported liquidity of Rs 1,379 crore at September 2026, compared with Rs 1,316 crore at June 2026 and Rs 1,626 crore at December 2025. Consolidated capital-to-risk-weighted-assets ratio, or CRAR, was 33.5% at September 2026, marginally below 33.8% at June 2026 and 47.0% at September 2025.
Standalone CRAR increased to 30.2% at September 2026 from 28.6% at June 2026, though it was below 36.5% a year earlier. Consolidated net worth rose to Rs 2,343 crore from Rs 2,140 crore in June 2026 and Rs 2,130 crore in March 2026. Spandana said the September 2026 consolidated net-worth figure includes proceeds from the final tranche of its rights issue.
Consolidated gearing was unchanged at 2.0 times between June and September 2026, after 1.5 times in September 2025. On the consolidated balance sheet, total assets rose to Rs 7,222 crore at September 30, 2026 from Rs 6,246 crore at March 31, 2026. Total equity increased to Rs 2,343 crore from Rs 2,130 crore over the same period.
Got a follow-up? Ask IRIS
How did lower funding costs relate to Spandana's Q2FY27 results?
Spandana reported net interest margin, or NIM, of 13.6% in Q2FY27, up from 12.5% in Q1FY27. Portfolio yield increased by 24 basis points to 24.9%, while the reported cost of borrowing declined by 48 basis points to 12.3%. The presentation attributed the NIM increase to higher yields and lower funding costs.
Net interest income increased 25% quarter on quarter to Rs 169 crore in Q2FY27, while total income rose 12% to Rs 340 crore. Finance cost increased 6% to Rs 141 crore, compared with a 16% increase in interest income on loans to Rs 309 crore. Pre-provision operating profit including recoveries was Rs 79 crore, versus Rs 40 crore in Q1FY27, and profit before tax rose to Rs 37 crore from Rs 18 crore.
Assets under management, or AUM, grew 10% quarter on quarter to Rs 5,364 crore at September 2026, while Q2FY27 disbursements increased 8% to Rs 1,481 crore. Consolidated gross non-performing assets declined to 2.54% from 3.64% in Q1FY27, and net non-performing assets declined to 0.50% from 0.68%. These metrics were reported alongside the lower Q2FY27 borrowing costs.
What does Spandana's maturity profile show?
Spandana reported a positive cumulative asset-liability management, or ALM, position at September 2026, stating that assets mature faster than liabilities on a cumulative basis. Average residual maturity of assets was 10.4 months, compared with 11.2 months for borrowings. In June 2026, the respective averages were 10.3 months and 10.2 months.
The standalone ALM schedule showed Rs 1,274 crore of assets against Rs 449 crore of liabilities in the up-to-one-month bucket. Assets also exceeded liabilities in the three-to-six-month bucket, at Rs 808 crore versus Rs 629 crore, and in the one-to-three-year bucket, at Rs 2,408 crore versus Rs 1,822 crore. The two-to-three-month bucket was matched, with Rs 275 crore on both sides.
The over-five-year bucket showed Rs 365 crore of assets against Rs 2,429 crore of liabilities. Spandana nevertheless described the overall position as positive on a cumulative basis and reported Rs 1,379 crore of closing liquidity as of September 30, 2026. The presentation therefore describes the maturity position cumulatively rather than as an excess of assets in every individual bucket.
Conclusion
Spandana's Q2FY27 funding data show a lower marginal borrowing cost alongside a larger bank share in its borrowing mix. The marginal rate declined to 10.6%, banks represented 57% of Rs 4,724 crore in outstanding borrowings, and the company reported Rs 1,379 crore of liquidity, 33.5% consolidated CRAR and a positive cumulative ALM position.
What to watch next is whether Spandana maintains the lower marginal funding rate while borrowing outstanding changes from the September 2026 level. Management also disclosed that its new loan origination system is in pilot, micro-LAP restructuring is under way with a focus on Rs 5 lakh to Rs 15 lakh ticket sizes, and the CFL merger is progressing as planned.