










Spandana returns to profit with Q2 PBT of Rs 37 crore
Key highlights
- Spandana reported Q2 FY27 profit before tax of Rs 37 crore, versus a Rs 327 crore loss a year earlier.
- Net interest income rose 86% year on year to Rs 169 crore, while total expenses fell 21% to Rs 148 crore.
- Assets under management grew 31% year on year to Rs 5,364 crore at September 2026, with Q2 disbursements of Rs 1,481 crore.
- Collection efficiency improved to 97.9% and GNPA declined to 2.54% in Q2 FY27.
powered by IRIS
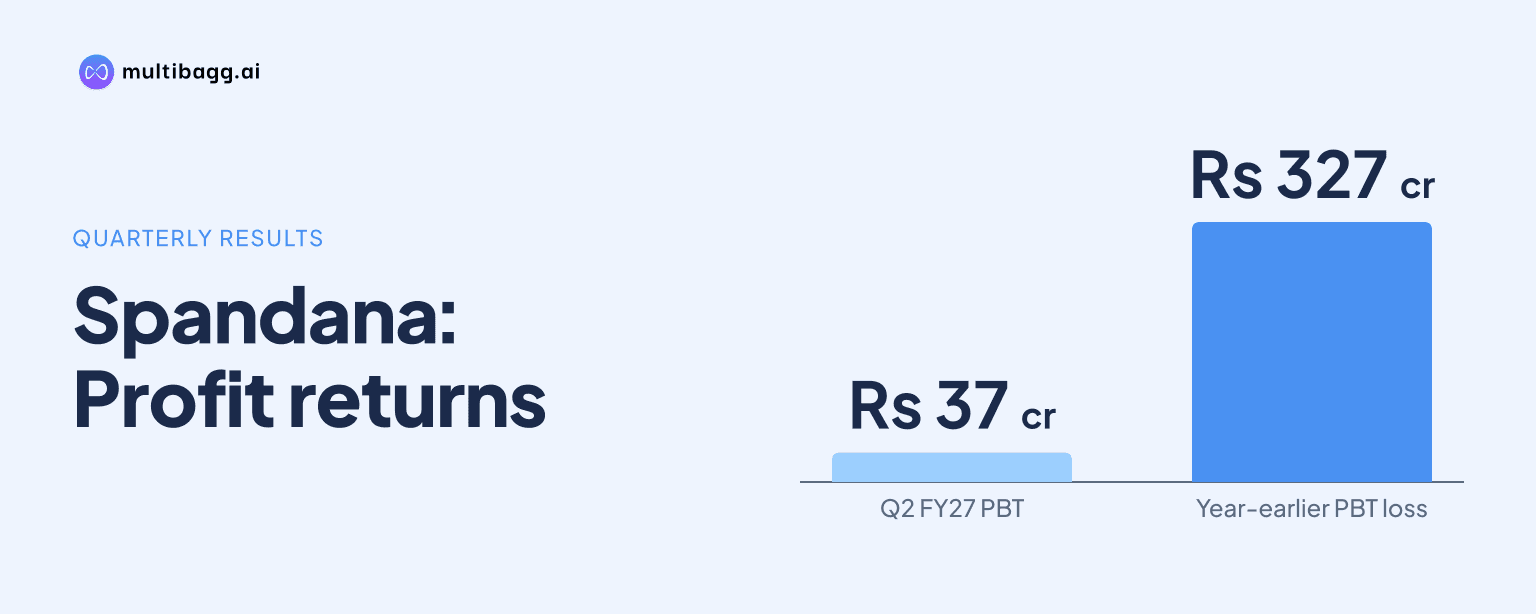
Spandana Sphoorty Financial Ltd returned to a pre-tax profit in the second quarter of fiscal year 2027 (Q2 FY27), reporting Rs 37 crore of profit before tax against a Rs 327 crore loss a year earlier. Spandana’s net interest income rose 86% to Rs 169 crore, while total expenses fell 21% and consolidated income-statement impairment declined to Rs 42 crore from Rs 287 crore.
Know Spandana Sphoorty Financial inside out
Results, valuation, peers and who's buying, in one view.
Why did Spandana return to profit in Q2 FY27?
Spandana returned to profit as growth in lending income and lower operating costs lifted pre-provision operating profit, while the consolidated impairment charge was lower than in Q2 FY26. Profit before tax (PBT) was Rs 37 crore in Q2 FY27, compared with a Rs 327 crore loss in Q2 FY26 and a Rs 18 crore profit in Q1 FY27. Profit after tax was Rs 18 crore, against a Rs 249 crore loss a year earlier.
Spandana’s total income increased 42% year on year to Rs 340 crore, while finance cost rose 17% to Rs 141 crore. Total expenses declined to Rs 148 crore from Rs 189 crore, comprising a 21% fall in employee benefit expense to Rs 103 crore and a 22% reduction in other expenses to Rs 43 crore. The Rs 19 crore tax expense included Rs 7.9 crore for derecognition of deferred tax assets related to the Criss Financial Ltd (CFL) merger scheme.
What lifted Spandana’s margin and net interest income?
Spandana lifted net interest margin (NIM) to 13.6% in Q2 FY27 from 8.4% in Q2 FY26 because its reported lending yield increased more than its cost of borrowing. Yield reached 24.9%, up 531 basis points from 19.6% a year earlier and 24 basis points from 24.6% in Q1 FY27. A basis point is one-hundredth of a percentage point.
Interest income on loans rose 47% year on year to Rs 309 crore, while total income from operations rose 42% to Rs 325 crore. Finance cost was Rs 21 crore above Q2 FY26, but increased less quickly than loan interest income. Net income after finance cost therefore rose 67% to Rs 200 crore, while net interest income increased 25% sequentially from Rs 135 crore in Q1 FY27.
Spandana’s cost of borrowing declined to 12.3% in Q2 FY27 from 12.8% in Q1 FY27, although it was 14 basis points above the 12.2% reported in Q2 FY26. Its marginal cost of borrowing was 10.6%, compared with 13.2% in Q3 FY26. The presentation attributes the NIM improvement to higher yields and lower funding costs.
How much did lower costs support Spandana’s turnaround?
Spandana’s lower expense base supported the turnaround, with total expenses falling 21% to Rs 148 crore even as total income increased by Rs 100 crore year on year. Its cost-to-income ratio declined to 65.3% from 126.8%, while operating expenditure as a share of assets under management (AUM) fell to 11.4% from 16.3%.
Pre-provision operating profit (PPOP), including recovery of loans written off, reached Rs 79 crore, up 98% from Rs 40 crore in Q1 FY27 and compared with a Rs 40 crore loss in Q2 FY26. The consolidated income statement shows Rs 52 crore of PPOP before recoveries and Rs 27 crore of recoveries. That recovery was below Rs 29 crore in Q2 FY26 but above Rs 24 crore in Q1 FY27.
Spandana operated with fewer outlets and employees than a year earlier. Branches totalled 1,438 at September 2026, down from 1,703 at September 2025, while employees fell to 9,908 from 13,400. Its active customer base was 11.4 lakh at September 2026, compared with 11.1 lakh in June 2026 and 15.5 lakh a year earlier.
Got a follow-up? Ask IRIS
Did Spandana’s asset quality improve in Q2 FY27?
Spandana reported lower non-performing loan ratios, with gross non-performing assets (GNPA) at 2.54% and net non-performing assets (NNPA) at 0.50% in Q2 FY27. GNPA declined by 309 basis points from 5.62% in Q2 FY26 and by 110 basis points from 3.64% in Q1 FY27. NNPA declined from 1.17% a year earlier and 0.68% in the preceding quarter.
At September 2026, consolidated Stage 3 loans, classified as GNPA, were Rs 132 crore, or 2.5% of Rs 5,215 crore in loans outstanding. Expected credit loss provision on Stage 3 loans was Rs 106 crore, equal to 80.2% coverage, while total expected credit loss provision was Rs 146 crore. Consolidated NNPA was Rs 26 crore, or 0.5% of loans outstanding.
The presentation also provides an impairment breakdown totalling Rs 15 crore for Q2 FY27, including Rs 72 crore related to technical write-offs, offset by Rs 31 crore on GNPA and Rs 27 crore in recoveries of loans written off. This differs from the Rs 42 crore impairment charge in the consolidated income statement, where recoveries are presented separately at Rs 27 crore. The presentation does not provide a reconciliation between the two disclosed impairment presentations.
How fast did Spandana grow lending and funding?
Spandana expanded AUM to Rs 5,364 crore at September 2026, up 10% from Rs 4,887 crore in June 2026 and 31% from Rs 4,088 crore a year earlier. Q2 FY27 disbursements were Rs 1,481 crore, up 8% sequentially and 59% year on year. First-half fiscal year 2027 disbursements reached Rs 2,853 crore, compared with Rs 1,214 crore in the first half of fiscal year 2026.
Collection efficiency improved during the period. Gross collection efficiency was 97.9% in Q2 FY27, compared with 92.9% in Q2 FY26 and 96.6% in Q1 FY27, while net collection efficiency was 97.3%, compared with 92.4% and 95.9%, respectively. The top five states accounted for 57% of AUM at September 2026, with the rest of India accounting for 43%.
Borrowings outstanding were Rs 4,724 crore at September 2026, up from Rs 3,289 crore a year earlier and Rs 4,291 crore in June 2026. Banks accounted for 57% of borrowing, compared with 48% a year earlier, while capital markets accounted for 23%, down from 29%. Liquidity was Rs 1,379 crore and the consolidated capital-to-risk-weighted-assets ratio was 33.5% at September 2026.
Conclusion
Spandana’s return to a Rs 37 crore pre-tax profit combined an 86% increase in net interest income, a 21% reduction in total expenses and lower consolidated income-statement impairment than in the prior-year quarter. AUM growth to Rs 5,364 crore, collection efficiency of 97.9% and GNPA of 2.54% accompanied the improvement, while NIM expanded by 514 basis points year on year to 13.6%.
The presentation identifies an optimal physical infrastructure as a driver of future growth. The next reported periods will show whether Spandana maintains lending yield of 24.9%, a marginal borrowing cost of 10.6% and collection efficiency of 97.9% as its loan book expands, supported by Rs 1,379 crore of liquidity and a 33.5% consolidated capital-to-risk-weighted-assets ratio.