










Spandana Sphoorty Financial Ltd NIM lifts Q2 PBT to Rs 37 crore
Key highlights
- Spandana reported Q2FY27 profit before tax of Rs 37 crore, compared with a Rs 327 crore loss in Q2FY26.
- Net interest margin rose to 13.6% in Q2FY27 from 8.4% a year earlier, while loan yield increased to 24.9%.
- Total expenses declined 21% year on year to Rs 148 crore, reducing the cost-to-income ratio to 65.3%.
- Spandana’s Q2FY27 impairment figures were unreconciled, with Rs 42 crore reported in the income statement versus Rs 15 crore in the presentation’s separate classification.
powered by IRIS
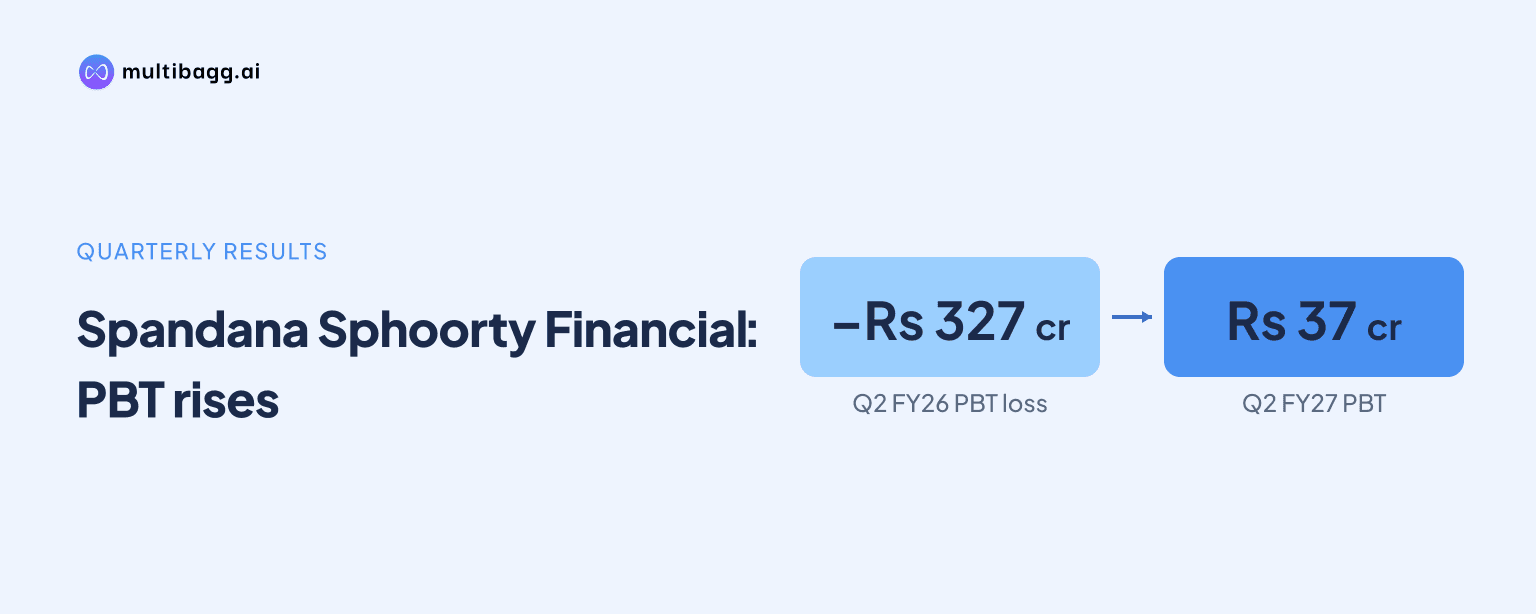
Spandana Sphoorty Financial Ltd reported consolidated profit before tax of Rs 37 crore in Q2FY27, compared with a Rs 327 crore loss in Q2FY26. Net interest margin reached 13.6%, up 514 basis points year on year, as loan yield rose to 24.9% and total expenses fell 21% to Rs 148 crore.
Know Spandana Sphoorty Financial Ltd Partly Paidup inside out
Results, valuation, peers and who's buying, in one view.
How did Spandana lift NIM to 13.6%?
Spandana lifted net interest margin, or NIM, to 13.6% in Q2FY27 from 12.5% in Q1FY27 and 8.4% in Q2FY26. The sequential increase was 111 basis points and the year-on-year increase was 514 basis points. One basis point equals one-hundredth of a percentage point.
Loan yield was the main disclosed contributor, rising to 24.9% in Q2FY27 from 24.6% in Q1FY27 and 19.6% in Q2FY26. The 531-basis-point year-on-year yield increase exceeded the 14-basis-point rise in cost of borrowing to 12.3% from 12.2%. On a sequential basis, borrowing cost fell 48 basis points from 12.8%.
The first-half figures show the movement extended beyond Q2FY27. Spandana’s H1FY27 yield was 24.8%, versus 19.2% in H1FY26, while NIM rose to 13.1% from 8.2%. Cost of borrowing in H1FY27 was 12.5%, 33 basis points above 12.2% a year earlier.
What drove Spandana’s Q2FY27 earnings turnaround?
Spandana reported consolidated profit before tax, or PBT, of Rs 37 crore in Q2FY27, up from Rs 18 crore in Q1FY27 and reversing the Rs 327 crore loss in Q2FY26. Net income, calculated after finance cost in the presentation, increased 17% sequentially to Rs 200 crore and 67% year on year from Rs 120 crore.
Interest income on loans rose to Rs 309 crore in Q2FY27, 16% above Rs 267 crore in Q1FY27 and 47% above Rs 210 crore in Q2FY26. Total income from operations increased 14% sequentially to Rs 325 crore, while total income including Rs 16 crore of non-operational income was Rs 340 crore, up 42% year on year.
Pre-provision operating profit, or PPOP, was Rs 52 crore in Q2FY27, compared with Rs 16 crore in Q1FY27 and a Rs 69 crore loss in Q2FY26. After adding Rs 27 crore of recoveries of loans written off, PPOP was Rs 79 crore, compared with Rs 40 crore in Q1FY27 and a Rs 40 crore loss a year earlier.
How did lower operating expenses affect Spandana’s profit?
Lower operating expenses contributed to Spandana’s Q2FY27 profit movement. Total expenses fell 4% from Rs 155 crore in Q1FY27 and 21% from Rs 189 crore in Q2FY26 to Rs 148 crore. Over the same sequential comparison, net income increased by Rs 29 crore to Rs 200 crore.
Employee benefit expense declined to Rs 103 crore in Q2FY27 from Rs 106 crore in Q1FY27 and Rs 130 crore in Q2FY26. Other expenses were Rs 43 crore, down from Rs 46 crore and Rs 54 crore respectively, while depreciation and amortisation fell to Rs 2 crore from Rs 3 crore sequentially and Rs 4 crore a year earlier.
Operating expenses as a share of assets under management, or AUM, were 11.4% in Q2FY27, compared with 13.3% in Q1FY27 and 16.3% in Q2FY26. The cost-to-income ratio declined to 65.3% from 79.5% sequentially and 126.8% year on year, according to the presentation.
Profit after tax was Rs 18 crore in Q2FY27, compared with Rs 12 crore in Q1FY27 and a Rs 249 crore loss in Q2FY26. Tax expense was Rs 19 crore, including Rs 7.9 crore for derecognition of a deferred tax asset arising from the Criss Financial Ltd merger scheme.
Got a follow-up? Ask IRIS
What did impairment and first-half results show?
The consolidated income statement records impairment on financial instruments of Rs 42 crore in Q2FY27, up 88% from Rs 22 crore in Q1FY27 but below Rs 287 crore in Q2FY26. PPOP including recoveries increased by Rs 39 crore sequentially to Rs 79 crore, which exceeded the Rs 20 crore sequential increase in the income-statement impairment charge.
A separate impairment classification in the presentation reports total Q2FY27 impairment of Rs 15 crore. It lists Rs 72 crore for technical write-offs, offset by Rs 31 crore relating to gross non-performing assets, Rs 27 crore of recovery of loans written off and other items. The presentation does not reconcile this Rs 15 crore total with the Rs 42 crore reported in the consolidated income statement.
For H1FY27, Spandana reported PBT of Rs 55 crore, against a Rs 808 crore loss in H1FY26. Total income rose 18% to Rs 644 crore, finance cost was Rs 273 crore versus Rs 274 crore, and total expenses declined 24% to Rs 303 crore. PPOP including recoveries was Rs 119 crore, compared with a Rs 79 crore loss in the prior-year half.
H1FY27 profit after tax was Rs 30 crore, compared with a Rs 609 crore loss in H1FY26, while impairment on the income statement fell to Rs 64 crore from Rs 729 crore. Return on assets based on on-book portfolio outstanding was 1.3%, versus negative 24.6%, and return on equity was 2.8%, versus negative 50.9%.
Conclusion
Spandana’s Q2FY27 turnaround reflected wider lending spreads, lower operating costs and lower year-on-year impairment. The company reported a 24.9% loan yield, a 13.6% NIM and Rs 148 crore of expenses, producing Rs 37 crore of PBT after the Rs 327 crore loss reported in Q2FY26.
The disclosed Criss Financial Ltd merger-related tax item remains relevant because Rs 7.9 crore of Q2FY27 tax expense arose from deferred-tax-asset derecognition. The presentation also leaves unreconciled the Rs 42 crore Q2FY27 impairment charge in the income statement and the Rs 15 crore total in its impairment classification, making that distinction a matter to watch in subsequent disclosures.