










SS Retail EBITDA margin rose to 5.3% in FY26, above mobile peers
Key highlights
- SS Retail's EBITDA margin rose from 2.1% in FY22 to 5.3% in FY26.
- SS Retail's FY26 EBITDA margin was 5.3%, versus 1.0% for mobile retail peers in its benchmark.
- SS Retail revenue increased from Rs 555 crore in FY22 to Rs 2,351 crore in FY26.
- SS Retail's gross margin rose from 8.7% in FY22 to 12.2% in FY26.
powered by IRIS
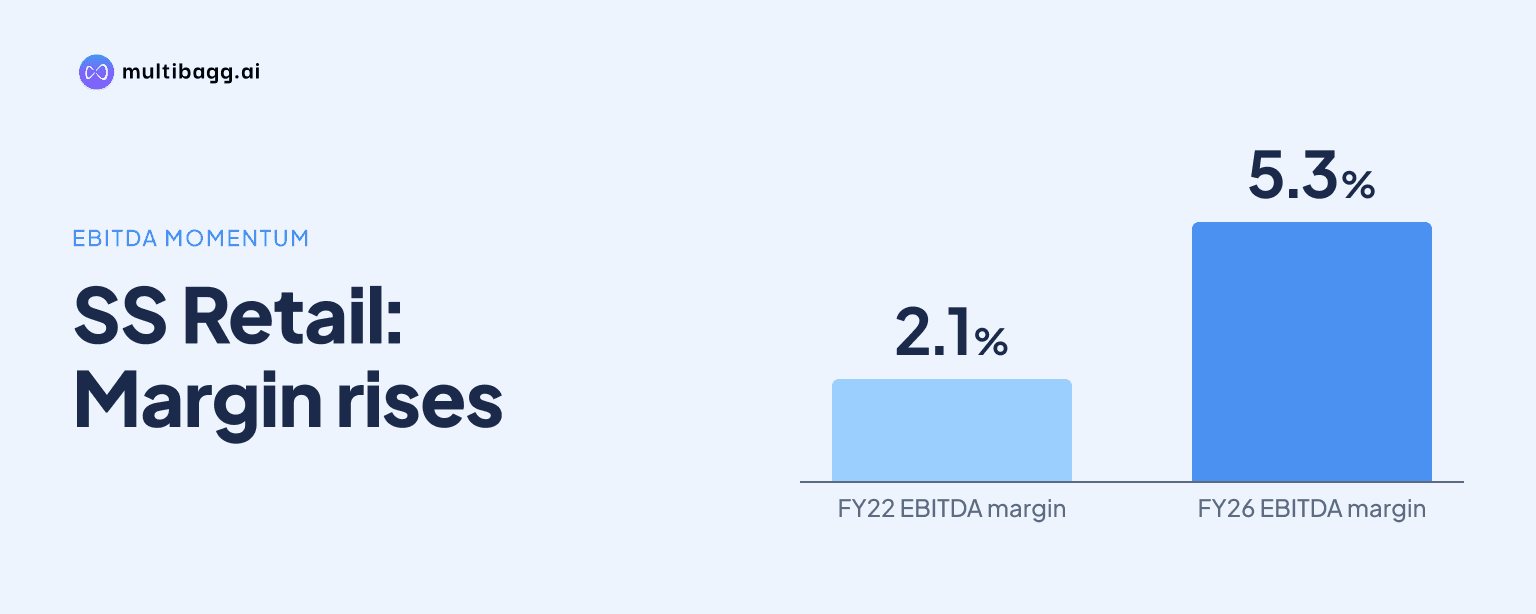
SS Retail Limited increased earnings before interest, tax, depreciation and amortisation (EBITDA) margin to 5.3% in FY26 from 2.1% in FY22, a 3.2-percentage-point rise, while its stated mobile-retail peer benchmark was 1.0% in FY26. Revenue increased from Rs 555 crore in FY22 to Rs 2,351 crore in FY26.
Know SS Retail inside out
Results, valuation, peers and who's buying, in one view.
What drove SS Retail's EBITDA margin expansion?
SS Retail's presentation does not identify a single quantified cause of its EBITDA-margin expansion, but it reports higher gross margin, improving profit after tax (PAT) margin and a larger store base over FY22 to FY26. EBITDA margin rose from 2.1% in FY22 to 5.0% in FY25 and 5.3% in FY26, while store count increased from 121 to 503.
Gross margin increased by 3.5 percentage points, from 8.7% in FY22 to 12.2% in FY26. The measure rose to 9.5% in FY23, 10.7% in FY24 and 12.1% in FY25; SS Retail attributed the subsequent 12.7% gross margin in H1 FY27 to product mix.
PAT margin also moved higher, reaching 2.5% in FY26 from 1.3% in FY22. It was 1.4% in FY23 and 2.2% in FY24 before remaining at 2.5% in FY25 and FY26; SS Retail said operational efficiencies supported the improvement, and reported a 3.0% PAT margin in H1 FY27.
How does SS Retail compare with mobile retail peers?
SS Retail reported a 5.3% EBITDA margin in FY26, compared with 1.0% for mobile retail peers in its benchmark. The 4.3-percentage-point FY26 gap widened from 1.8 percentage points in FY23, when SS Retail recorded 3.8% and mobile retail peers recorded 2.0%.
SS Retail remained below the large-appliances peer benchmark, which was 7.4% in FY26 against its 5.3%. Large-appliances peers declined from 8.1% in FY23 to 7.4% in FY26, while the mobile-retail benchmark fell from 2.0% to 1.0%; SS Retail's margin moved from 3.8% to 5.3% over the same period.
Revenue compound annual growth rate (CAGR) for FY23 to FY26 was 40% for SS Retail, versus 29% for mobile retail peers and 15% for large-appliances peers. PAT CAGR was 49% for SS Retail, compared with 55% for mobile retail peers and 12% for large-appliances peers, while FY26 working-capital days were 45, 35 and 85 respectively.
Got a follow-up? Ask IRIS
Which operating model supports SS Retail's margins?
SS Retail's H1 FY27 network was led by company-operated, franchisee-owned (COFO) stores, which represented about 71% of revenue. Company-owned, company-operated (COCO) stores accounted for about 21% of revenue and franchisee-owned, franchisee-operated (FOFO) stores for about 8%, across 67 COCO, 393 COFO and 114 FOFO stores.
SS Retail retains ownership of inventory across all 574 stores in the three formats and uses centralised procurement with a hub-and-spoke supply chain. Under COFO, it bears operating expenses and links partner commissions to monthly revenue and profitability targets; under FOFO, the partner bears lease and operating expenses while SS Retail earns a fixed margin on inventory sold.
The company reported average capital expenditure of Rs 15 lakh for a COCO or COFO store, average working capital of Rs 1.2 crore per store and average store-level breakeven of six months. It also reported a 33-month payback period including working capital, 540 square feet of average store size in H1 FY27 and a 3.65% average store-closure rate.
FY26 revenue per store was Rs 5.7 crore and revenue per square foot was more than Rs 1.46 lakh. As the format mix changed between FY24 and FY26, COFO's revenue contribution declined from 77% to 71%, while FOFO's share increased from 3% to 8%; SS Retail reported 507 COFO and FOFO stores as of September 30, 2026.
What could affect SS Retail's margin path next?
Management has set a 750-store ambition for 2028 and identifies store maturity, direct sourcing and inventory efficiencies as its operating-leverage levers. It also plans to scale pre-owned phones, accessories and allied categories, which the presentation describes as higher-margin adjacencies; its FY28E chart shows 5% and 6% EBITDA-margin markers without defining the two figures.
Mobile Exchange Wala is one such adjacency, with revenue rising from Rs 5 crore in FY23 to Rs 169 crore in FY26 and store count increasing from seven to 71. SS Retail reported that 108 of 574 stores had the format as of September 30, 2026, and targets about 30% penetration by FY29 from less than 20% currently.
Working-capital execution is another disclosed measure as the network expands. Working-capital days were 45 in FY26 and 48 in H1 FY27, while inventory days rose from 47 to 55; receivable days fell from three to one and payable days increased from four to eight over the same periods.
Conclusion
SS Retail combined revenue growth from Rs 555 crore in FY22 to Rs 2,351 crore in FY26 with EBITDA-margin expansion from 2.1% to 5.3%. Its FY26 margin was above the company's 1.0% mobile-retail peer benchmark, although below the 7.4% large-appliances peer figure, while gross margin rose to 12.2% and PAT margin reached 2.5%.
The next disclosed milestones are progress toward the 750-store ambition for 2028 and Mobile Exchange Wala's target of about 30% store penetration by FY29. Management's stated margin levers are store maturity, direct sourcing, inventory efficiencies and higher-margin adjacencies, while inventory days were 55 in H1 FY27 versus 47 in FY26.