










Supriya Lifescience FY26 revenue reaches Rs 827.9 crore
Key highlights
- Supriya Lifescience reported FY26 revenue of Rs 827.9 crore, compared with Rs 530.1 crore in FY22.
- FY26 PAT was Rs 209.1 crore, up from Rs 89.9 crore in FY23.
- Supriya Lifescience reported a FY26 debt-to-equity ratio of 0.00x under its stated definition.
- Net working capital increased to 170 days in FY26 from 124 days in FY24.
powered by IRIS
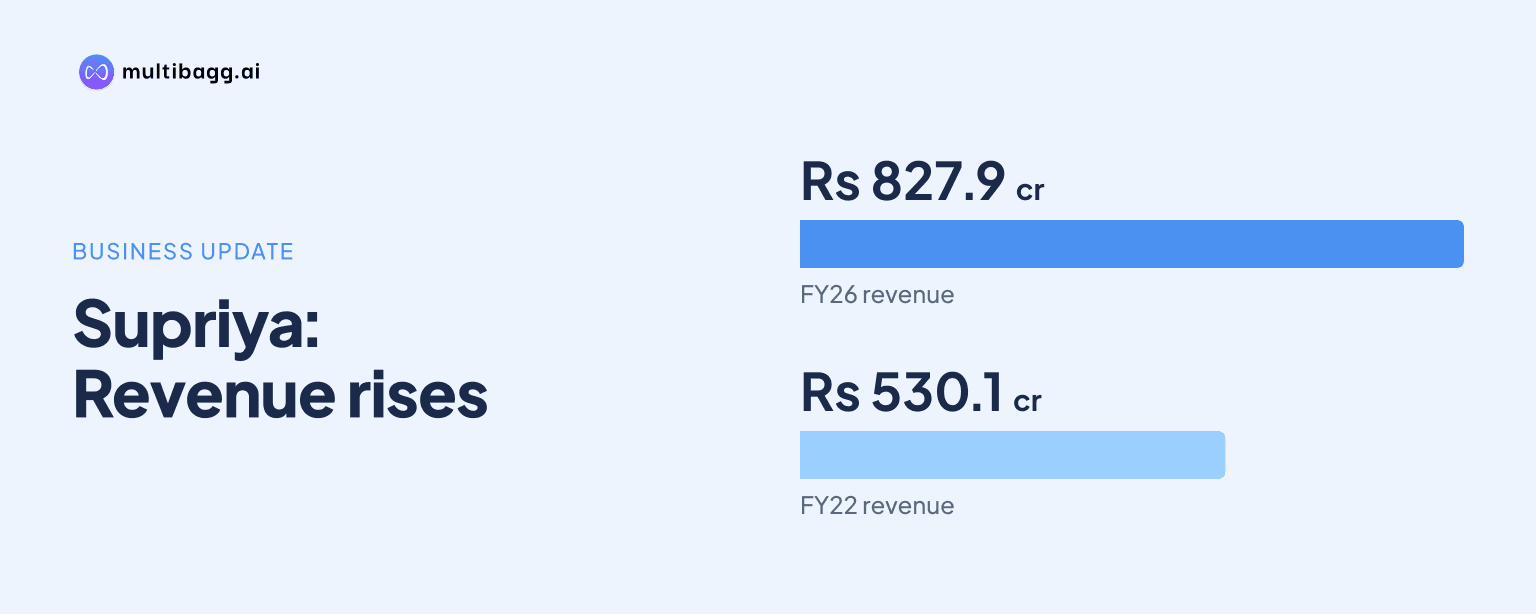
Supriya Lifescience Limited reported FY26 revenue of Rs 827.9 crore, compared with Rs 530.1 crore in FY22, and reported debt-to-equity of 0.00x in FY26. The five-year series also shows profit recovering from FY23, while net working-capital days rose to 170 in FY26 from the FY24 low of 124 days.
Know Supriya Lifescience inside out
Results, valuation, peers and who's buying, in one view.
How did Supriya Lifescience revenue change from FY22 to FY26?
Supriya Lifescience increased revenue by Rs 297.8 crore between FY22 and FY26, reaching Rs 827.9 crore from Rs 530.1 crore. The presentation places 12% alongside the five-year revenue series, although it does not specify the calculation or period represented by that figure. Revenue declined to Rs 460.9 crore in FY23, then increased for three consecutive years.
FY26 revenue was Rs 131.4 crore above FY25 revenue of Rs 696.5 crore, the largest year-on-year increase in the reported series. The FY23 revenue decline of Rs 69.2 crore from FY22 was followed by increases of Rs 109.4 crore in FY24 and Rs 126.2 crore in FY25. The presentation does not provide revenue by product, customer, geography or operating segment for these years.
Capital expenditure increased from Rs 94.9 crore in FY22 to Rs 162.3 crore in FY25 before declining by Rs 10.1 crore to Rs 152.2 crore in FY26. Total reported capital expenditure across FY22 to FY26 was Rs 662.9 crore. The presentation reports annual spending but does not identify the funding source or project-wise allocation for those amounts.
How did Supriya Lifescience profitability recover after FY23?
Supriya Lifescience reported EBITDA of Rs 294 crore and PAT of Rs 209.1 crore in FY26, up from Rs 128.9 crore and Rs 89.9 crore, respectively, in FY23. EBITDA means earnings before interest, tax, depreciation and amortisation, while PAT means profit after tax. Both measures declined in FY23 and then increased in each of FY24, FY25 and FY26.
FY26 EBITDA was Rs 154 crore higher than FY23, while FY26 PAT was Rs 119.2 crore higher than the FY23 figure. Compared with FY22, FY26 EBITDA increased by Rs 80 crore and PAT increased by Rs 57.3 crore. The presentation provides the reported earnings figures but does not give the drivers of the FY23 decline or the subsequent recovery.
Return on net worth did not follow the earnings progression exactly. It fell from 24.7% in FY22 to 12.9% in FY23, recovered to 15.0% in FY24 and 18.9% in FY25, and then eased to 17.5% in FY26. FY26 was therefore 7.2 percentage points below FY22 and 1.4 percentage points below FY25, despite EBITDA and PAT reaching their highest reported levels in the five-year series.
Got a follow-up? Ask IRIS
What leverage and capital spending did Supriya Lifescience report?
Supriya Lifescience reported debt-to-equity of 0.00x in FY26, compared with 0.04x in FY22. Its presentation defines debt as current and non-current borrowings plus lease liabilities, and defines equity as total shareholders’ equity. The FY26 figure is a reported rounded ratio and does not establish that borrowings or lease liabilities were zero.
The ratio declined from 0.04x in FY22 to 0.03x in FY23, then to 0.01x in FY24 and FY25 before reaching 0.00x in FY26. This progression occurred while annual capital expenditure ranged from Rs 94.9 crore in FY22 to Rs 162.3 crore in FY25. The source does not provide a cash-flow bridge linking capital expenditure, borrowing changes and internal funding across the five years.
FY26 capital expenditure of Rs 152.2 crore was Rs 57.3 crore above the FY22 amount, although it was below FY25 by Rs 10.1 crore. Management also discloses that a new vitamin product block was commissioned and that civil work for debottlenecking across production blocks had begun. It further says a new production block at Lote and a nasal line are planned, without giving spending estimates or completion dates.
How did Supriya Lifescience working-capital days change through FY26?
Supriya Lifescience reported net working capital of 170 days in FY26, up from 124 days in FY24 but below 196 days in FY22 and 235 days in FY23. The FY24 reading was the lowest of the five reported years. Net working capital rose by 12 days from FY25 and by 46 days from FY24 to FY26.
Inventory was 197 days in FY26, nearly unchanged from 198 days in FY25 but 32 days above FY24's 165 days. Receivables increased to 78 days in FY26 from 72 days in FY25 and 61 days in FY23. Inventory had reached 233 days in FY23, the highest point in the reported inventory series.
Payables were 105 days in FY26, compared with 112 days in FY25 and 113 days in FY24, while remaining above the FY22 level of 49 days. The combination of higher receivables, lower payables and inventory remaining at 197 days coincided with the 12-day FY25-to-FY26 increase in net working capital. The presentation provides these reported days but does not explain the operating causes of the changes.
Conclusion
The FY22-to-FY26 record shows Supriya Lifescience increasing revenue from Rs 530.1 crore to Rs 827.9 crore and PAT from Rs 151.8 crore to Rs 209.1 crore, despite the FY23 decline in both measures. Capital expenditure totalled Rs 662.9 crore over the five years, while the reported debt-to-equity ratio moved from 0.04x to 0.00x. Net working capital, however, rose to 170 days in FY26 after reaching 124 days in FY24.
The next disclosed milestones are management’s plan to file six dossiers in the European Union during the current financial year, add a production block at Lote and establish a new nasal line. Management also says 30 finished-dosage products are under development, with five product exhibits completed and progress towards 10 exhibits. Future disclosures can show whether these plans coincide with changes in FY26 inventory of 197 days, receivables of 78 days and net working capital of 170 days.