










Tieramet Q2 revenue rises 79% as PAT more than triples YoY
Key highlights
- Tieramet reported Q2FY27 revenue of Rs 1,034.6 crore, up 79.0% year on year.
- Tieramet’s Q2FY27 PAT was Rs 30.5 crore, up 205.3% year on year, and PAT margin was 2.95%.
- Exports represented 28% of Tieramet’s copper sales in Q2FY27, compared with 10% in Q2FY26.
- Tieramet’s total borrowings were Rs 478.4 crore at 30 September 2026, versus Rs 258.2 crore at 31 March 2026.
powered by IRIS
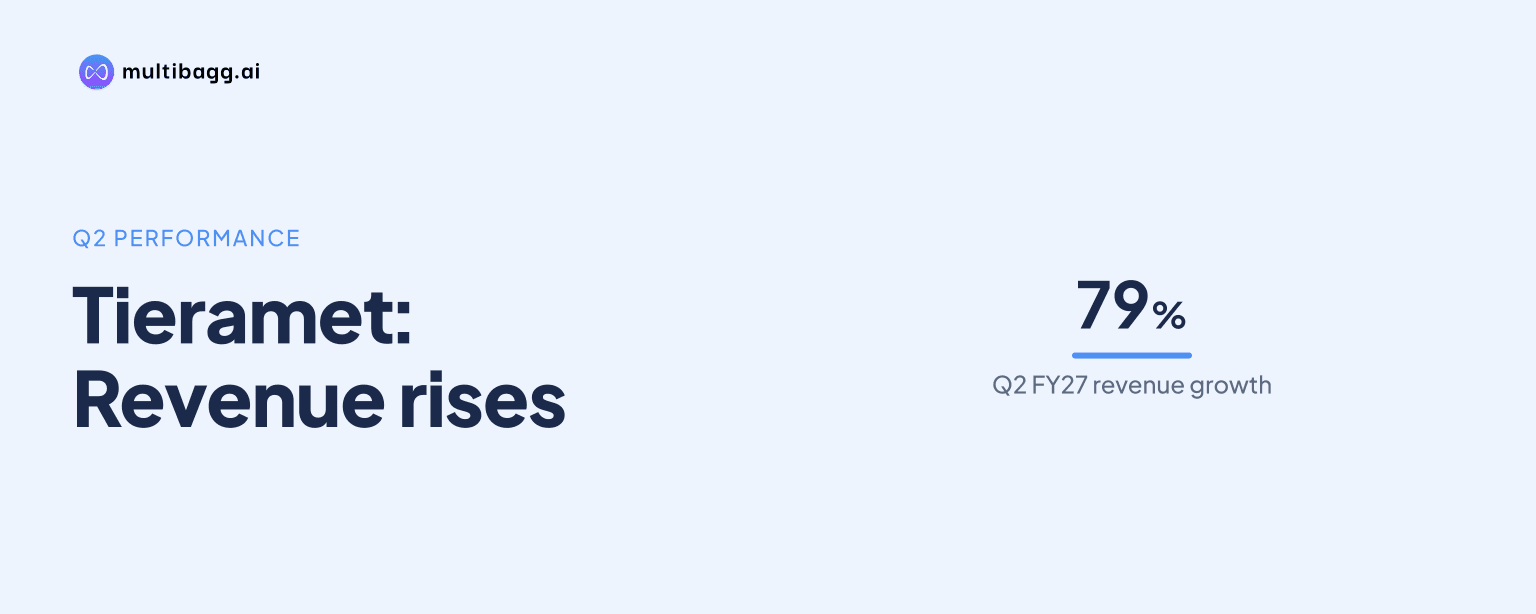
Tieramet Limited reported Q2FY27 revenue of Rs 1,034.6 crore, up 79.0% year on year, and profit after tax of Rs 30.5 crore, up 205.3%. The result combined 7,313 metric tonnes of sales volume, Rs 1,363 per kg realisation and an export share of 28% of copper sales, compared with 10% a year earlier.
Know Bhagyanagar India inside out
Results, valuation, peers and who's buying, in one view.
What drove Tieramet’s Q2FY27 revenue and profit growth?
Tieramet’s Q2FY27 revenue growth reflected higher sales volume and realisation, with volume rising 7.1% year on year to 7,313 metric tonnes, or MT, and realisation increasing to Rs 1,363 per kg from Rs 826 per kg in Q2FY26. Management attributed the 79.0% year-on-year and 47.1% quarter-on-quarter revenue increase to strong volumes and higher realisation. Revenue was Rs 577.9 crore in Q2FY26 and Rs 703.5 crore in Q1FY27.
Tieramet’s profit rose faster than revenue, as earnings before interest, tax, depreciation and amortisation, or EBITDA, increased 124.4% year on year to Rs 52.6 crore and profit after tax, or PAT, rose 205.3% to Rs 30.5 crore. EBITDA was Rs 23.4 crore in Q2FY26 and Rs 38.1 crore in Q1FY27, while PAT was Rs 10 crore and Rs 20.1 crore, respectively. Profit before tax reached Rs 40.9 crore in Q2FY27 after Rs 10.2 crore of interest and Rs 1.5 crore of depreciation.
How did Tieramet’s margins and unit economics change?
Tieramet’s EBITDA margin improved to 5.08% in Q2FY27 from 4.06% in Q2FY26, but was below 5.41% in Q1FY27. PAT margin rose to 2.95% from 1.73% a year earlier and from 2.86% in the preceding quarter. Thus, the year-on-year profit increase occurred alongside higher margins, while the sequential EBITDA margin declined by 33 basis points.
Tieramet reported EBITDA per kg of Rs 72 in Q2FY27, unchanged from Q1FY27 and up from Rs 34 in Q2FY26. Value addition per kg increased to Rs 114 from Rs 66 a year earlier, although it declined from Rs 116 in Q1FY27. Sales volume increased 38.6% sequentially from 5,278 MT, so Q2 growth combined higher volume with stable sequential EBITDA per kg rather than a rise in that measure.
What was Tieramet’s product and export mix in Q2FY27?
Tieramet said value-added products accounted for 60% of declared sales quantity in Q2FY27, led by bus bars at 32% of volume. Commodity products represented 40%, auto and switchgear 13%, motor and transformers 11%, and other by-products 4%. Compared with Q1FY27, commodity share increased from 37% while auto and switchgear declined from 16%.
Tieramet’s exports accounted for 28% of copper sales in Q2FY27, compared with 10% in Q2FY26 and 18% in Q1FY27. The export share therefore increased by 18 percentage points year on year and by 10 percentage points sequentially. The presentation described exports as nearly tripling from the year-earlier quarter.
Tieramet’s volume mix also changed from FY26, when commodity products formed 38% and bus bars 35% of sales volume. In Q2FY27, commodity share was 40% and bus bars were 32%, while motor and transformers reached 11% from 10% in FY26. The presentation provides volume shares rather than revenue or profit by product category, so it does not quantify each segment’s earnings contribution.
Got a follow-up? Ask IRIS
How did Tieramet’s balance sheet change by September 2026?
Tieramet’s total assets rose to Rs 895 crore at 30 September 2026 from Rs 612.9 crore at 31 March 2026. Current assets increased to Rs 802 crore from Rs 539.3 crore, including trade receivables of Rs 384.7 crore versus Rs 201.7 crore and inventories of Rs 302.7 crore versus Rs 230.1 crore. Cash and cash equivalents were Rs 10 lakh at both reporting dates.
Tieramet’s total borrowings increased to Rs 478.4 crore at 30 September 2026 from Rs 258.2 crore at 31 March 2026. Current borrowings rose to Rs 404.3 crore from Rs 215 crore, while non-current borrowings increased to Rs 74.1 crore from Rs 43.2 crore. Total equity rose to Rs 341.3 crore from Rs 240.5 crore, including other equity of Rs 334.6 crore.
Tieramet’s current liabilities were Rs 473.5 crore at 30 September 2026, compared with Rs 323.3 crore at 31 March 2026. Trade payables to other creditors declined to Rs 55.9 crore from Rs 78.8 crore, while current borrowings rose by Rs 189.3 crore. The disclosed balance sheet therefore records increases in receivables, inventories and borrowings during the first half of FY27.
What are Tieramet’s capex, capacity and restructuring plans?
Tieramet has stated an FY30 revenue target of Rs 5,000 crore and an installed-capacity target of 45,000 MT per annum. It also disclosed a Rs 40 crore capital-expenditure plan for FY27-FY28, with Rs 9.45 crore spent at the date of the presentation. The presentation reported return on equity of 29.68% and return on capital employed of 20.95%.
Tieramet’s copper business demerger became effective on 1 October 2026 after National Company Law Tribunal sanction on 7 September 2026. The record date was 8 October 2026, and shareholders received one Tieramet share with Rs 2 face value for each Bhagyanagar India Ltd share held on that date. Shares were credited to demat accounts on 30 October 2026.
Tieramet said listing applications had been filed with the National Stock Exchange of India and BSE, with listing expected by December 2026. Under the scheme, Tieramet holds the copper business, while Bhagyanagar India Ltd retained windmill and land-parcel assets. The presentation also reported an upgraded ICRA A- stable credit rating.
Conclusion
Tieramet’s Q2FY27 performance paired 79.0% revenue growth with a 205.3% rise in PAT, supported by Rs 1,363 per kg realisation, 7,313 MT of sales volume and exports representing 28% of copper sales. EBITDA margin improved by 102 basis points year on year to 5.08%, although it remained below the 5.41% recorded in Q1FY27.
The next disclosed matters to watch are spending under the Rs 40 crore FY27-FY28 capex plan, progress towards the FY30 targets of Rs 5,000 crore revenue and 45,000 MT annual capacity, and the management-stated expectation of listing on the National Stock Exchange of India and BSE by December 2026. Movements in Rs 384.7 crore of receivables, Rs 302.7 crore of inventories and Rs 478.4 crore of borrowings are also relevant to that expansion.