










Tolins Tyres targets 75% utilisation from 38%-54% Q2 range
Key highlights
- Tolins Tyres targets 75% capacity utilisation over the next few years.
- Q2 FY27 utilisation was 46.74% for tyres, 53.92% for Indian PCTR and 38.25% for UAE PCTR.
- Tyre sales rose to 1,63,297 units in Q2 FY27 from 1,09,723 units in Q1 FY27.
- Exports represented 10.65% of Q2 FY27 revenue, up from 6.05% in Q2 FY26.
powered by IRIS
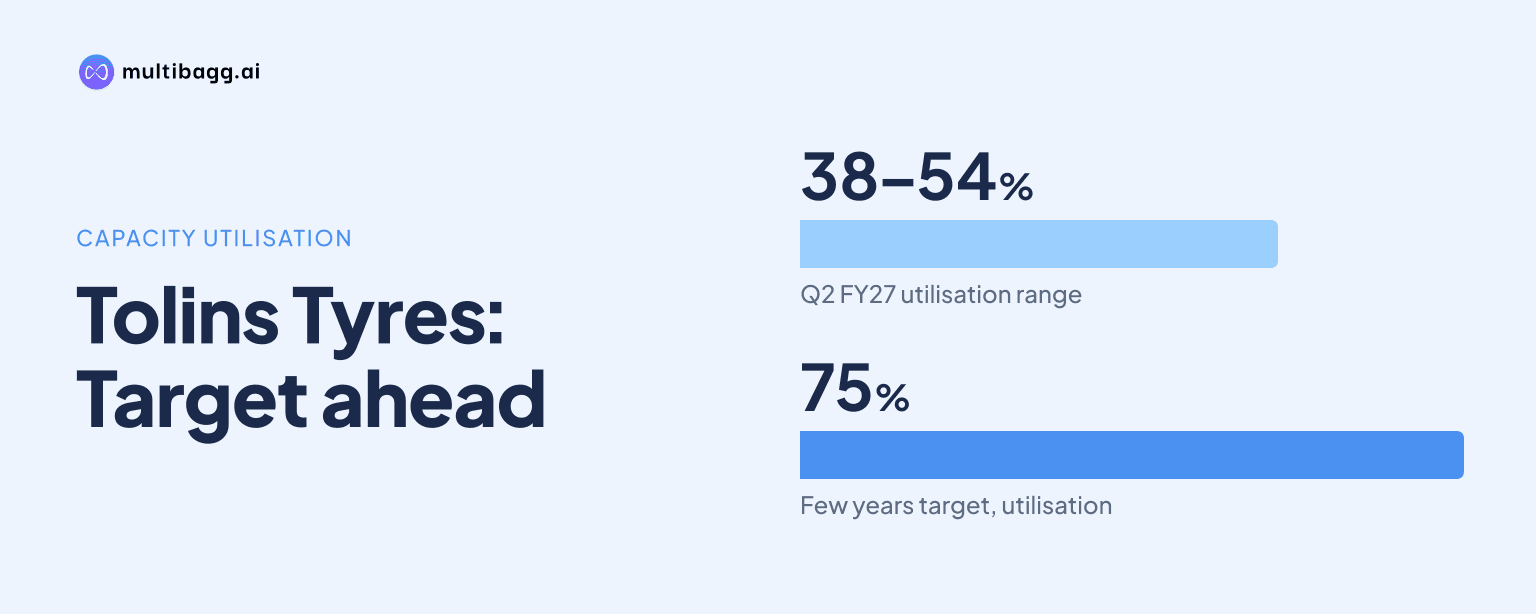
Tolins Tyres Limited aims to progressively raise capacity utilisation to 75% over the next few years, from Q2 FY27 rates of 46.74% in tyres, 53.92% in Indian precured tread rubber and 38.25% in UAE precured tread rubber. Management places the target within a plan for market expansion, technology enablement and higher asset productivity.
Know Tolins Tyres inside out
Results, valuation, peers and who's buying, in one view.
What were Tolins Tyres’ Q2 FY27 utilisation rates?
Tolins Tyres operated its three disclosed manufacturing lines at 38.25% to 53.92% utilisation in Q2 FY27. Its tyre operation used 46.74% of quarterly capacity of 3,77,100 units, while the Indian precured tread rubber, or PCTR, operation used 53.92% of 2,822 tonnes. The PCTR facility operated by wholly owned foreign subsidiary Tolins Tyres LLC used 38.25% of its 300-tonne quarterly capacity.
Indian PCTR had the highest Q2 FY27 rate at 53.92%, while UAE PCTR had the lowest at 38.25%. The operations produce different outputs, with tyre capacity measured in units and PCTR capacity in tonnes. Tolins Tyres reports annual manufacturing capacity of 1.51 million tyre units, 12,486 tonnes of tread rubber and 17,160 tonnes of rubber compounds.
The disclosed capacity of all three lines was unchanged from Q2 FY26 through Q2 FY27. Tyre capacity remained 3,77,100 units per quarter, Indian PCTR capacity stayed at 2,822 tonnes, and UAE PCTR capacity stayed at 300 tonnes. The stated utilisation objective therefore concerns greater output from the existing disclosed capacity rather than an announced expansion of these lines.
How did Tolins Tyres’ utilisation change in Q2 FY27?
Tolins Tyres’ tyre and both PCTR operations improved sequentially in Q2 FY27, but UAE PCTR remained below its Q2 FY26 rate. Tyre utilisation rose from 42.29% in Q1 FY27 to 46.74% in Q2 FY27, Indian PCTR increased from 49.92% to 53.92%, and UAE PCTR increased from 36.50% to 38.25%.
Against Q2 FY26, tyre utilisation increased from 45.38% to 46.74% and Indian PCTR increased from 52.62% to 53.92%. UAE PCTR declined from 43.59% in Q2 FY26 to 38.25% a year later. This made the UAE line the only disclosed operation with lower year-on-year utilisation in Q2 FY27.
None of the three operations reached the 75% objective in the five reported quarters from Q2 FY26 to Q2 FY27. Indian PCTR came closest at 59.46% in Q3 FY26, followed by 57.50% in Q4 FY26. Tyres peaked at 48.40% in Q3 FY26, while UAE PCTR reached 46.95% in the same quarter.
How does Tolins Tyres plan to reach 75% utilisation?
Tolins Tyres says it aims to progressively increase capacity utilisation to 75% over the next few years. The presentation does not give a year-by-year pathway, a plant-specific target or a deadline for reaching 75%. It includes the objective in its Way Forward plan alongside domestic and international expansion, technology systems, new products and selective acquisitions.
Management says Tolins Tyres will expand its domestic presence and focus on key international clusters. Exports represented 10.65% of Q2 FY27 revenue, compared with 8.15% in Q1 FY27 and 6.05% in Q2 FY26. Domestic revenue remained 89.35% in Q2 FY27, but the export share increased over both comparison periods.
Technology enablement is another disclosed mechanism. Tolins Tyres says it will further develop technology systems to increase asset productivity, although it does not disclose a capital expenditure amount, implementation date or operating metric for this initiative. It also plans investment in new products and selective strategic acquisitions in rubber and rubber-related products, without naming an acquisition target or product-launch schedule.
Got a follow-up? Ask IRIS
Which sales trends could support higher Tolins Tyres output?
Tyre sales rose to 1,63,297 units in Q2 FY27 from 1,09,723 units in Q1 FY27 and 1,37,294 units in Q2 FY26. This movement coincided with tyre utilisation rising to 46.74% in Q2 FY27 from 42.29% in the preceding quarter. Tyres contributed 35.26% of operational revenue in Q2 FY27, up from 32.25% in Q1 FY27.
PCTR sales were 1,275 tonnes in Q2 FY27, compared with 1,062 tonnes in Q1 FY27 and 967 tonnes in Q2 FY26. Tread rubber remained the larger operating revenue category at 64.74% in Q2 FY27, although its share declined from 67.75% in Q1 FY27 and 68.03% in Q2 FY26. The revenue mix therefore moved towards tyres while tread rubber remained the majority category.
Other product volumes also increased sequentially in Q2 FY27. Rubber compound sales were 1,523 tonnes versus 1,308 tonnes in Q1 FY27, bonding gum sales were 269 tonnes versus 111 tonnes, and flap sales were 17,310 units versus 15,775 units. Tolins Tyres also manufactures bonding gum, vulcanising solutions, tyre flaps and tubes as backward-integrated products.
How did Tolins Tyres’ financial performance change in Q2 FY27?
Tolins Tyres reported Q2 FY27 revenue from operations of Rs 94.72 crore, up from Rs 66.10 crore in Q2 FY26, while earnings before interest, tax, depreciation and amortisation, or EBITDA, increased to Rs 9.61 crore from Rs 8.94 crore. EBITDA margin declined to 10.15% from 13.53%, and profit after tax, or PAT, decreased to Rs 6.50 crore from Rs 6.95 crore. The presentation does not attribute these margin movements to capacity utilisation.
In H1 FY27, revenue from operations increased to Rs 173.98 crore from Rs 155.85 crore in H1 FY26. EBITDA declined to Rs 18.52 crore from Rs 22.38 crore and EBITDA margin fell to 10.65% from 14.36%. PAT was Rs 12.69 crore, compared with Rs 16.26 crore in the prior-year half.
The annual comparison also showed revenue growth alongside lower profitability. FY26 revenue from operations was Rs 327.12 crore, up 11.86% from Rs 292.45 crore in FY25, while EBITDA declined 17.46% to Rs 47.80 crore. EBITDA margin was 14.61% in FY26 versus 19.80% in FY25, and PAT was Rs 35.69 crore versus Rs 38.67 crore.
Conclusion
Tolins Tyres has material disclosed unused capacity, with Q2 FY27 utilisation between 38.25% and 53.92% against management’s 75% objective. All three lines improved from Q1 FY27, alongside higher tyre and PCTR sales, but the UAE PCTR operation remained below both its Indian counterpart and its own 43.59% utilisation rate in Q2 FY26.
The next measure is whether management’s plans for domestic and international expansion, technology systems and new products produce sustained plant-level utilisation gains. Tolins Tyres has described 75% as a progressive goal over the next few years, but has not disclosed interim milestones, facility-specific targets or a completion date.