










Tolins Tyres Q2 revenue rises 43% as PAT falls 7% on margin squeeze
Key highlights
- Tolins Tyres' Q2 FY27 revenue from operations rose 43.29% to Rs 94.72 crore.
- Tolins Tyres' Q2 FY27 PAT fell 6.54% to Rs 6.50 crore.
- Tolins Tyres' Q2 FY27 EBITDA margin declined 338 basis points to 10.15%.
- Tolins Tyres' export revenue share increased to 10.65% in Q2 FY27 from 6.05% a year earlier.
powered by IRIS
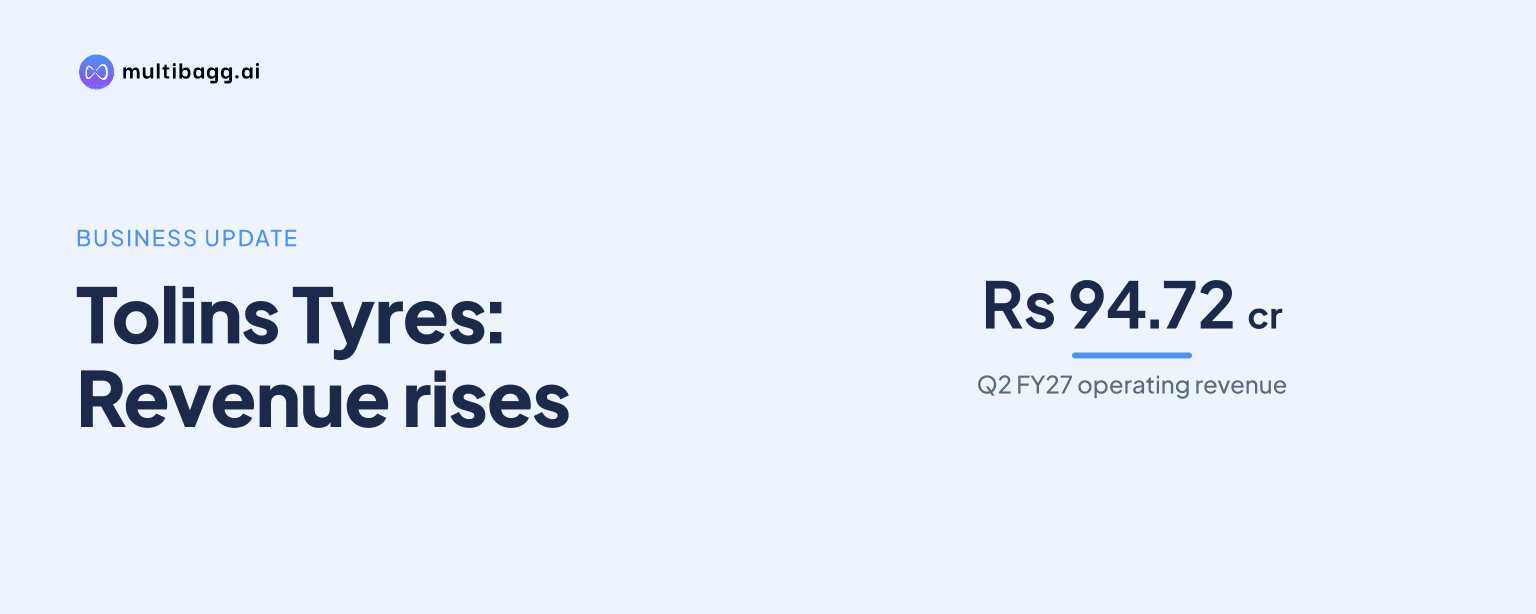
Tolins Tyres Limited reported Q2 FY27 revenue from operations of Rs 94.72 crore, up 43.29% year on year, but profit after tax fell 6.54% to Rs 6.50 crore as earnings before interest, tax, depreciation and amortisation margin declined 338 basis points to 10.15%.
Know Tolins Tyres inside out
Results, valuation, peers and who's buying, in one view.
How did Tolins Tyres perform in Q2 FY27?
Tolins Tyres delivered higher sales but lower net profit in Q2 FY27, the second quarter of fiscal year 2027. Revenue from operations increased by Rs 28.62 crore to Rs 94.72 crore from Rs 66.10 crore in Q2 FY26, while profit after tax, or PAT, decreased by Rs 0.45 crore to Rs 6.50 crore. Total revenue, including other income, rose 42.35% to Rs 95.16 crore, although other income declined to Rs 0.44 crore from Rs 0.75 crore.
Earnings before interest, tax, depreciation and amortisation, or EBITDA, rose 7.49% to Rs 9.61 crore from Rs 8.94 crore, substantially below total revenue growth of 42.35%. EBITDA margin therefore fell to 10.15% from 13.53%, while PAT margin declined to 6.86% from 10.52%. Basic earnings per share, or EPS, moved to Rs 1.64 from Rs 1.76.
Why did Tolins Tyres' margins decline despite revenue growth?
Tolins Tyres' margin contraction coincided with raw-material expense rising faster than total revenue. Raw-material cost increased by Rs 27.43 crore to Rs 76.55 crore in Q2 FY27 from Rs 49.12 crore a year earlier, while total revenue grew by Rs 28.31 crore. Total expenditure rose to Rs 85.11 crore from Rs 57.16 crore, limiting EBITDA growth to Rs 0.67 crore.
Management attributed the pressure to volatility in natural rubber and other crude-linked raw materials, which it said affected input costs and profitability. Profit before tax increased 5.59% to Rs 8.61 crore, but tax expense rose to Rs 2.12 crore from Rs 1.21 crore, resulting in the decline in PAT. Depreciation was Rs 1.10 crore and interest was Rs 0.34 crore, compared with Rs 1.07 crore and Rs 0.46 crore respectively in Q2 FY26.
How did Tolins Tyres perform in H1 FY27?
Tolins Tyres' first-half results showed sales growth alongside lower operating and net earnings. Revenue from operations in H1 FY27, the first half of fiscal year 2027, increased 11.63% to Rs 173.98 crore from Rs 155.85 crore in H1 FY26. EBITDA fell 17.22% to Rs 18.52 crore, while PAT declined 21.96% to Rs 12.69 crore from Rs 16.26 crore.
H1 FY27 EBITDA margin was 10.65%, down 371 basis points from 14.36% in H1 FY26, and PAT margin fell 314 basis points to 7.29%. Raw-material cost rose to Rs 139.43 crore from Rs 116.47 crore, while total revenue increased 11.02% to Rs 174.67 crore. H1 FY27 EPS was Rs 3.21, compared with Rs 4.11 a year earlier.
Got a follow-up? Ask IRIS
Which volumes and markets supported Tolins Tyres' sales growth?
Tolins Tyres said Q2 FY27 revenue growth was supported by improved business volumes, with tyre sales increasing 48.83% and PCTR volumes increasing 20.02%. The quarterly sales-mix table lists tyre sales of 1,63,297 units in Q2 FY27, compared with 1,37,294 units in Q2 FY26. It lists PCTR volume at 1,275 tonnes in Q2 FY27 and 967 tonnes in Q2 FY26; the presentation does not reconcile this table with management's stated 20.02% PCTR growth.
The revenue mix shifted towards tyres, which represented 35.26% of operational revenue in Q2 FY27, up from 31.97% in Q2 FY26. Tread rubber's share fell to 64.74% from 68.03%. Exports accounted for 10.65% of geographical revenue, up from 6.05%, while domestic revenue represented 89.35%; the top 10 customers accounted for 44.92% of revenue, versus 49.45% a year earlier and 41.33% in Q1 FY27.
What operational measures is Tolins Tyres pursuing?
Tolins Tyres said it is pursuing operational efficiency, product-mix optimisation and improved capacity utilisation in response to margin pressure. Tyre capacity was unchanged at 3,77,100 units in Q2 FY27, while utilisation rose to 46.74% from 45.38% in Q2 FY26 and 42.29% in Q1 FY27. The presentation did not disclose an increase in tyre capacity during the period.
At Tolins Tyres' standalone operation, PCTR capacity was 2,822 tonnes and utilisation reached 53.92% in Q2 FY27, compared with 52.62% a year earlier. Its wholly owned foreign subsidiary had PCTR capacity of 300 tonnes, but utilisation declined to 38.25% from 43.59%. Management also said it intends to strengthen distribution, expand domestic and international presence, and enhance market reach.
Conclusion
Tolins Tyres' Q2 FY27 figures show that higher revenue and sales volumes did not translate into higher net profit. Revenue from operations rose 43.29% to Rs 94.72 crore, but raw-material cost increased by Rs 27.43 crore and EBITDA margin fell to 10.15%. The H1 FY27 pattern was more pronounced, with revenue up 11.63% and PAT down 21.96%.
The next results will indicate whether management's plans for cost efficiency, product-mix optimisation, distribution and capacity utilisation affect margins. Disclosed factors to watch include volatility in natural-rubber and crude-linked inputs, export contribution after it reached 10.65% in Q2 FY27, and utilisation at the 3,77,100-unit tyre operation and 2,822-tonne standalone PCTR operation.