










Tolins Tyres H1 cash flow stays negative at Rs 21.53 lakh
Key highlights
- Tolins Tyres reported a Rs 2.153 crore operating cash outflow for the half year ended 30 September 2026.
- Trade receivables increased by Rs 37.369 crore to Rs 165.853 crore from 31 March 2026.
- Higher trade payables supplied Rs 20.784 crore of cash and closed at Rs 29.455 crore.
- Current borrowings increased by Rs 4.99 crore to Rs 15.302 crore at 30 September 2026.
powered by IRIS
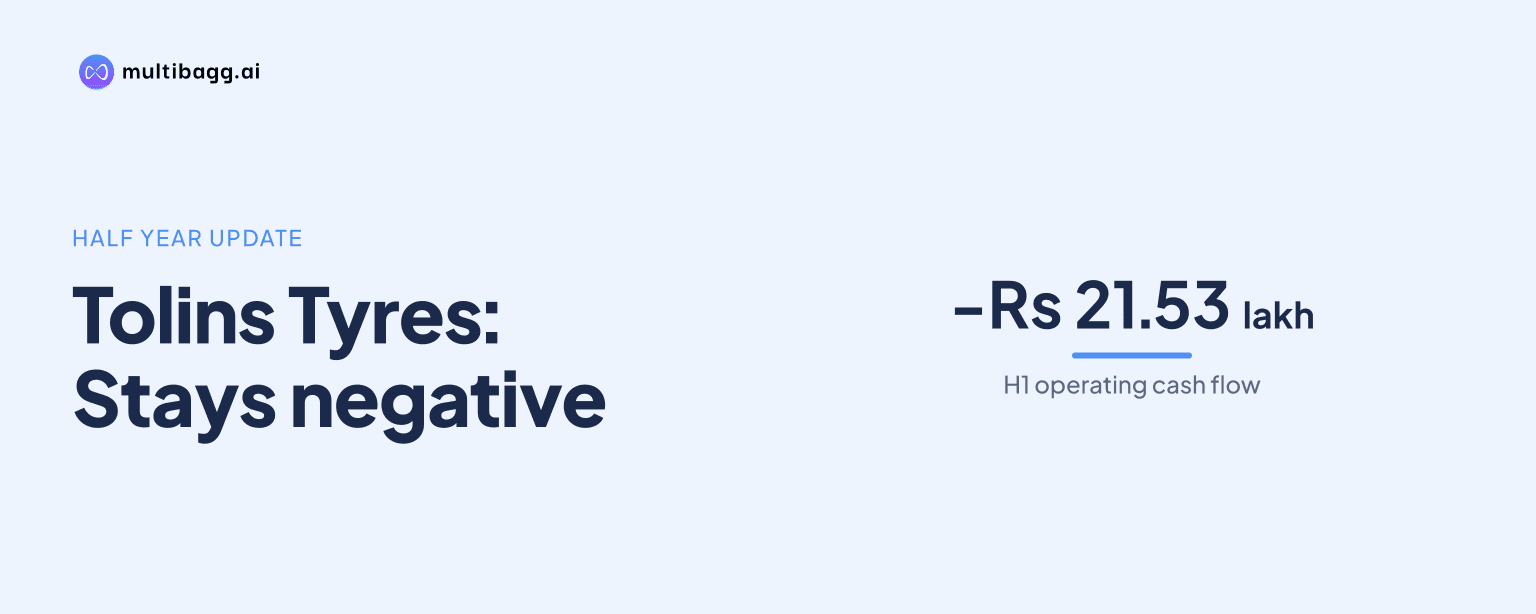
Tolins Tyres Limited reported a consolidated operating cash outflow of Rs 21.53 lakh for the half year ended 30 September 2026, despite profit after tax of Rs 12.687 crore, as trade receivables increased by Rs 37.369 crore. A Rs 20.784 crore increase in trade payables partly offset the receivables-related cash use.
Know Tolins Tyres inside out
Results, valuation, peers and who's buying, in one view.
Why was Tolins Tyres’ H1 operating cash flow negative?
Tolins Tyres reported negative operating cash flow because working-capital movements and tax payments absorbed more cash than operations generated in the half year ended 30 September 2026. Cash generated from operations was Rs 1.653 crore after working-capital changes, while net income tax paid was Rs 3.806 crore, resulting in a Rs 2.153 crore net cash outflow from operating activities.
The cash outcome differed from the group’s reported earnings. Profit before tax was Rs 16.493 crore and profit after tax was Rs 12.687 crore for the six months, while operating profit before working-capital changes was Rs 19.36 crore. Working-capital changes reduced this pre-working-capital operating profit by Rs 17.707 crore.
Operating cash flow improved from an outflow of Rs 13.955 crore in the half year ended 30 September 2025. Aggregate working-capital use narrowed by Rs 15.638 crore year on year, and cash generated from operations before tax payments moved from a Rs 9.444 crore deficit to a Rs 1.653 crore inflow.
How much did Tolins Tyres’ trade receivables rise?
Tolins Tyres’ trade receivables rose by Rs 37.369 crore during the half year ended 30 September 2026, reaching Rs 165.853 crore from Rs 128.484 crore at 31 March 2026. This was the largest adverse item in the group’s working-capital cash movements and was greater than its Rs 19.36 crore operating profit before working-capital changes.
Revenue from operations increased to Rs 173.984 crore in the six months ended 30 September 2026 from Rs 155.846 crore in the corresponding 2025 period. However, the trade receivables turnover ratio declined to 1.05 times from 1.33 times, while the reported receivables-days measure increased to 174.45 days from 137.18 days.
Closing trade receivables also increased through the second quarter. The balance was Rs 165.853 crore at 30 September 2026, compared with Rs 145.501 crore at 30 June 2026 and Rs 116.826 crore at 30 September 2025. Second-quarter revenue was Rs 94.718 crore, versus Rs 79.266 crore in the June 2026 quarter and Rs 66.103 crore a year earlier.
Got a follow-up? Ask IRIS
Which other working-capital movements affected Tolins Tyres’ cash?
Tolins Tyres received a Rs 20.784 crore cash benefit from higher trade payables during the latest half year, partly offsetting the Rs 37.369 crore receivables increase. Total trade payables rose to Rs 29.455 crore at 30 September 2026 from Rs 8.671 crore at 31 March 2026, including Rs 27.827 crore due to creditors other than micro and small enterprises.
The trade-payable contribution was Rs 16.438 crore higher than the Rs 4.346 crore cash inflow in the half year ended 30 September 2025. Trade payables turnover declined to 4.53 times from 7.08 times, while the associated days measure rose to 40.43 days from 25.83 days; credit purchases were Rs 133.308 crore, compared with Rs 135.884 crore a year earlier.
Inventory released Rs 2.028 crore of cash as inventory declined to Rs 178.853 crore at 30 September 2026 from Rs 180.882 crore at 31 March 2026. This contrasted with a Rs 23.527 crore inventory-related cash outflow in the prior-year half. Other current assets released Rs 1.642 crore, while lower current tax liabilities and current provisions used Rs 3.994 crore and Rs 2.334 crore respectively.
How did Tolins Tyres fund its cash requirements?
Tolins Tyres generated Rs 4.443 crore from financing activities in the half year ended 30 September 2026. Current borrowings increased by Rs 4.99 crore and non-current borrowings by Rs 10.6 lakh, while interest paid was Rs 65.3 lakh. Current borrowings were Rs 15.302 crore at 30 September 2026, compared with Rs 10.313 crore at 31 March 2026.
Financing inflows exceeded the Rs 4.853 crore investing cash outflow and helped meet the operating cash outflow. Investing activity included Rs 5.444 crore spent on property, plant and equipment, partly offset by a Rs 3.096 crore reduction in capital work-in-progress. Bank balances other than cash and cash equivalents increased by Rs 2.596 crore during the period.
Cash and cash equivalents fell by Rs 2.563 crore to Rs 1.852 crore at 30 September 2026 from Rs 4.415 crore at the beginning of the half year. Total current assets increased to Rs 361.745 crore from Rs 328.392 crore, while current liabilities increased to Rs 51.093 crore from Rs 30.045 crore. The current ratio was 7.08 times at 30 September, compared with 10.93 times at 31 March 2026.
Conclusion
Tolins Tyres’ first-half figures show that higher revenue of Rs 173.984 crore and profit after tax of Rs 12.687 crore did not translate into positive operating cash generation. The Rs 37.369 crore expansion in receivables exceeded the cash supplied by Rs 20.784 crore higher payables and by the Rs 2.028 crore reduction in inventory.
The unresolved item to watch is whether receivables, which stood at Rs 165.853 crore and 174.45 reported days at 30 September 2026, moderate in subsequent results. Current borrowings of Rs 15.302 crore, up Rs 4.99 crore during the half year, and trade payables of Rs 29.455 crore are also relevant to how Tolins Tyres funds working-capital needs.