










Tolins Tyres exports reach 10.65% as tyre sales rise 49%
Key highlights
- Exports represented 10.65% of Tolins Tyres revenue in Q2 FY27, up from 8.15% in Q1 FY27.
- Tyre unit sales reached 163,297 in Q2 FY27, 49% above Q1 FY27.
- Tyres accounted for 35.26% of operational revenue in Q2 FY27, versus 31.97% in Q2 FY26.
- The top 10 customers accounted for 44.92% of Q2 FY27 revenue.
powered by IRIS
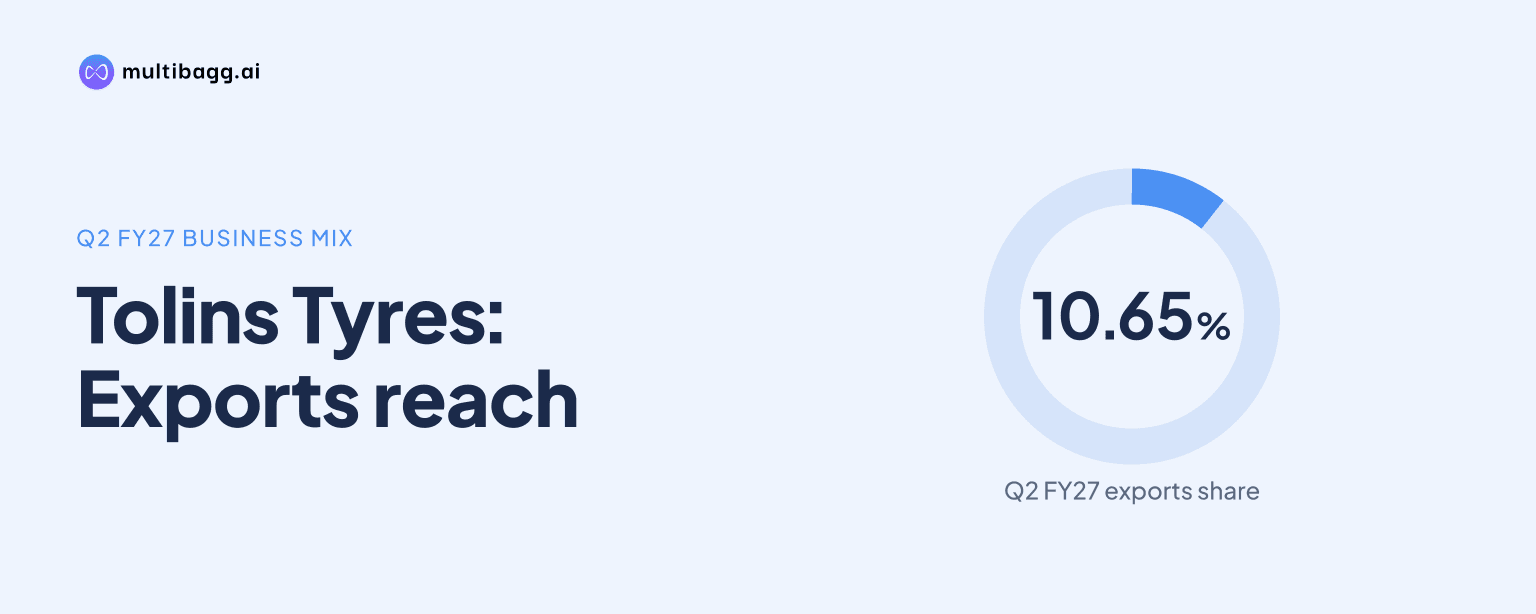
In Q2 FY27, Tolins Tyres Limited reported exports at 10.65% of revenue, up from 8.15% in Q1 FY27, while tyre sales rose 49% sequentially to 163,297 units. Tyres also contributed 35.26% of operational revenue, although the top 10 customers accounted for 44.92% of revenue.
Know Tolins Tyres inside out
Results, valuation, peers and who's buying, in one view.
How did Tolins Tyres’ geographical revenue mix change in Q2 FY27?
Exports supplied 10.65% of Tolins Tyres’ Q2 FY27 revenue, compared with 8.15% in Q1 FY27 and 6.05% in Q2 FY26. This was the highest export proportion in the five quarters presented, while the domestic share declined to 89.35% from 91.85% in the preceding quarter and 93.95% a year earlier. The figures describe revenue mix, not the absolute value of exports.
The quarter-on-quarter shift was 2.50 percentage points toward exports, and the year-on-year shift was 4.60 percentage points. In Q4 FY26, exports had represented 2.30% of revenue, with domestic revenue at 97.70%; therefore, the Q2 FY27 mix represents a change from that quarter. The presentation does not identify the countries, customers or product categories responsible for export revenue.
Did Tolins Tyres sell more tyres and other product categories?
Tolins Tyres sold 163,297 tyres in Q2 FY27, up 49% from 109,723 in Q1 FY27 and 19% from 137,294 in Q2 FY26. Tyre volumes also exceeded the 155,790 units reported in Q3 FY26, making Q2 FY27 the highest quarter among the five periods shown. The sales increase coincided with tyre capacity utilisation of 46.74%, up from 42.29% in Q1 FY27 on unchanged quarterly capacity of 377,100 units.
Other reported categories moved differently. Tonnage in the presentation’s PCTR category reached 1,275 tonnes in Q2 FY27, above 1,062 tonnes in Q1 FY27 and 967 tonnes in Q2 FY26. Rubber compound sales were 1,523 tonnes, higher than 1,308 tonnes sequentially but below 1,645 tonnes a year earlier. Bonding gum rose to 269 tonnes from 111 tonnes in Q1 FY27, while flap sales increased to 17,310 units from 15,775 units.
The operational revenue split also moved toward tyres. Tyres accounted for 35.26% of operational revenue in Q2 FY27, versus 32.25% in Q1 FY27 and 31.97% in Q2 FY26. Tread rubber’s share was 64.74%, down from 67.75% sequentially and 68.03% a year earlier. These percentages show a change in revenue composition, while the unit data show that tyre volumes grew faster than several other reported categories.
Got a follow-up? Ask IRIS
How concentrated was Tolins Tyres’ customer base in Q2 FY27?
Tolins Tyres derived 44.92% of Q2 FY27 revenue from its top 10 customers, up from 41.33% in Q1 FY27 but below 49.45% in Q2 FY26. The sequential increase of 3.59 percentage points followed a Q1 FY27 low in the five-quarter series. The measure covers customer concentration, and the presentation does not name the customers or disclose the revenue contribution of any individual account.
The top-10 share was 47.89% in Q3 FY26 and 48.20% in Q4 FY26 before falling to 41.33% in Q1 FY27. At 44.92%, the Q2 FY27 reading shows that nearly 45% of revenue remained linked to 10 customers even as the export share reached 10.65%. The supplied material does not state whether the leading customers are domestic or export buyers, so no geographic conclusion can be drawn from the two metrics together.
What did the sales-mix shift coincide with in Q2 FY27 financial results?
Tolins Tyres recorded Rs 94.72 crore in revenue from operations in Q2 FY27, compared with Rs 66.10 crore in Q2 FY26, while total revenue rose 42.35% to Rs 95.16 crore. Earnings before interest, tax, depreciation and amortisation (EBITDA), excluding other income, increased 7.49% to Rs 9.61 crore. EBITDA margin, however, was 10.15%, compared with 13.53% a year earlier.
Profit after tax was Rs 6.50 crore in Q2 FY27, down 6.54% from Rs 6.95 crore in Q2 FY26, and the profit-after-tax margin declined to 6.86% from 10.52%. Raw-material cost increased to Rs 76.55 crore from Rs 49.12 crore, while employee cost rose to Rs 4.82 crore from Rs 4.08 crore. The presentation reports these financial movements alongside the sales-mix data, but does not attribute the margin change to exports, tyres or customer concentration.
For H1 FY27, revenue from operations was Rs 173.98 crore versus Rs 155.85 crore in H1 FY26, whereas EBITDA was Rs 18.52 crore against Rs 22.38 crore. The H1 FY27 EBITDA margin was 10.65%, down from 14.36%, and profit after tax was Rs 12.69 crore compared with Rs 16.26 crore. This means the Q2 revenue growth occurred within a first-half period in which reported profitability was lower year on year.
Conclusion
Tolins Tyres’ Q2 FY27 sales profile showed a higher export contribution, a 35.26% operational-revenue share for tyres and 49% sequential tyre-unit growth to 163,297. At the same time, top-10 customer dependence was 44.92%, and the quarter’s Rs 95.16 crore total revenue was accompanied by a 10.15% EBITDA margin, below the 13.53% recorded in Q2 FY26.
What to watch next is the development of the reclaim-rubber facility at Palakkad, Kerala, where Terra Rubber Pvt Ltd broke ground on 24 August 2026. Management said the project could create an additional raw-material stream and a potential opportunity to generate waste-tyre extended producer responsibility certificates, subject to Central Pollution Control Board registration and approvals.