










Tracxn India reaches 53% of revenue as quarterly growth hits 6.9%
Key highlights
- India accounted for 53% of Tracxn revenue in Q2FY27.
- India revenue grew 6.9% quarter on quarter in Q2FY27, which management annualised at approximately 30%.
- Investment Banks-India new closures increased from 9 to 13 per month in FY26 to 20 per month in Q1FY27.
- Investment Banks-India annualised revenue growth exceeded 40% in Q2FY27, versus about 20% year-on-year growth in FY26.
powered by IRIS
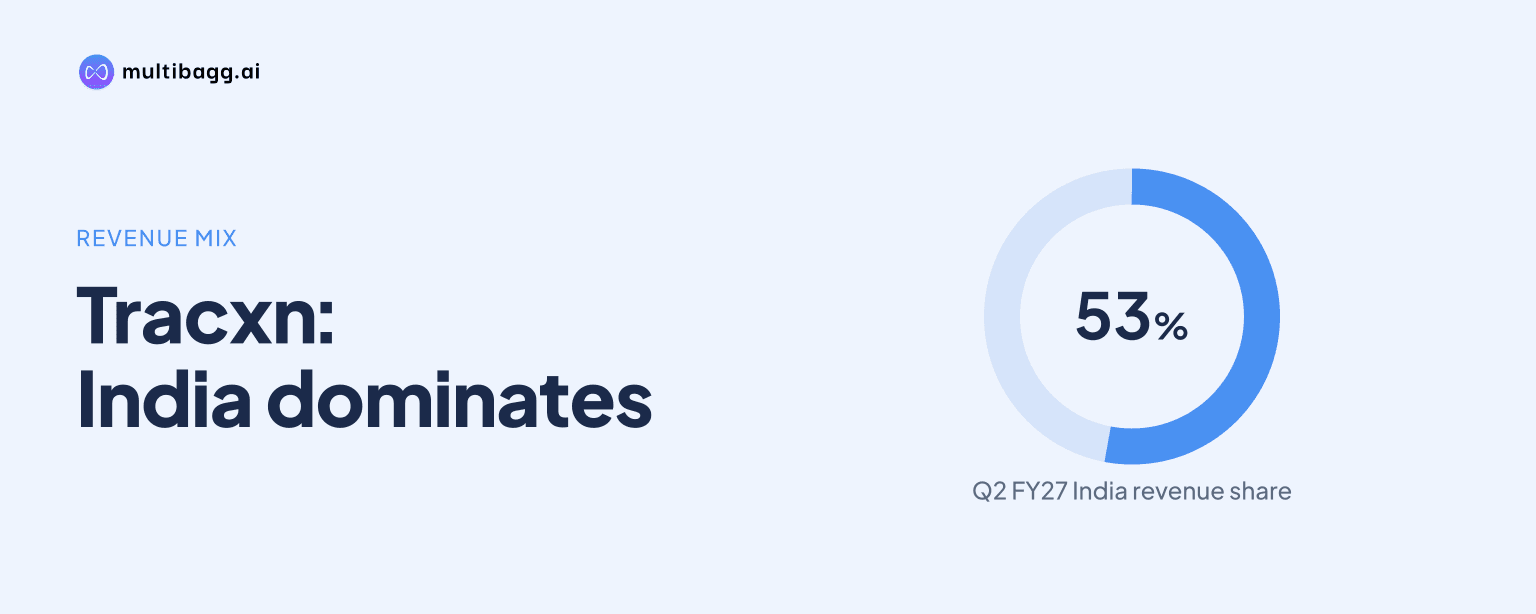
In Q2FY27, Tracxn’s India geography accounted for 53% of revenue and grew 6.9% quarter on quarter, a pace management described as an approximately 30% annualised run-rate. The company links the acceleration to two to three years of investment in India-focused data coverage and sales capacity.
Know Tracxn Technologies inside out
Results, valuation, peers and who's buying, in one view.
Why is Tracxn’s India revenue growth accelerating?
Tracxn’s India revenue growth is accelerating because quarterly growth rose to 6.9% in Q2FY27 from 4.4% in Q1FY27 and 5.1% in Q4FY26. India represented 53% of Tracxn revenue in Q2FY27, so its growth rate is material to the company’s geographic revenue mix. Management annualised the Q2FY27 pace at about 30%, which is a run-rate rather than reported full-year growth.
The reported trend shows a slowdown to 2.4% quarter-on-quarter growth in Q3FY26 before growth increased over the following three quarters. Growth was 3.3% in both Q1FY26 and Q2FY26, then reached 5.1% in Q4FY26 and 6.9% in Q2FY27. The latest rate was 5.4 percentage points above the 1.5% recorded in Q4FY25.
Tracxn says sustained investment in India data and sales over the past two to three years drove this progression and expects further acceleration. The presentation does not provide India revenue in rupees, the number of India customers, or the absolute contribution of individual India business units. Its disclosed evidence is therefore the 53% revenue share and quarterly growth sequence.
How does Tracxn’s three-phase growth model work?
Tracxn’s three-phase model starts with a specialised business-unit, or BU, sales team, moves to building a best-in-class offering, and ends with a sales scale-up. In phase I, sales teams are organised around customer segments within the existing customer base to build early momentum and identify unmet needs. The company indicates this stage takes about two quarters and can increase new customer acquisition by about 50%.
In phase II, Tracxn uses inputs from vertical teams to improve data coverage and product capabilities. The company says the intended outcome is improved win rates and conversion across the sales pipeline, with this work taking about three to four quarters. This means the product-building stage follows specialised sales activity rather than simply adding more sales staff.
In phase III, Tracxn expands sales capacity in BUs where conversion is higher. The stated duration is about two quarters, and the company associates the phase with revenue acceleration and market leadership. Its stated operating markers are around a fourfold increase in sales-team size and a 1% to 2% market-share increase per month, although no company-wide market-share figure is disclosed.
Taken together, the indicated timings suggest roughly seven to eight quarters across the three phases. The model separates the initial customer-acquisition push, data and product development, and capacity expansion. That sequence is consistent with management’s description of India as the result of investment made over a two-to-three-year period.
What does Investment Banks-India show about Tracxn’s model?
Tracxn’s Investment Banks-India BU is its example of a unit that has completed the specialised-team and offering-building stages and is now scaling sales. The team launched in Q3FY25, and Tracxn introduced live deals for investment banks to source merger-and-acquisition and fund-raise-ready companies in the same quarter. It added an investor database in Q1FY26 and made private-company financial coverage best-in-class in Q3FY26.
New closures rose from 9 per month to 13 per month during FY26, then reached 20 per month in Q1FY27. Tracxn plans to reach 30 monthly new closures, which remains a target rather than a reported result. The presentation also says the unit has added 1% of market share per month for the last 12-plus months, without disclosing its absolute market share.
Sales expansion remains ongoing, with the team growing from two representatives to seven and targeting eight productive representatives. Tracxn has also created a separate team to upgrade existing customers to a full-team plan. The increase from about 20% year-on-year revenue growth in FY26 to more than 40% annualised growth in Q2FY27 is the company’s reported case-study evidence for the playbook.
Got a follow-up? Ask IRIS
Which Tracxn BUs are ready to scale?
Tracxn lists Investment Banks-India and Venture Capital Funds-India in the sales-scale-up phase. Six BUs are at the specialised-team stage: Private Equity-India, Sales-International, Innovation-International, Mergers and Acquisitions-International, Startups, and Debt. The phase allocation shows that only two named BUs have reached sales scale-up under the company’s framework.
Six BUs are in the offering-building phase: Sales-India, Venture Capital-International, Investment Banks-International, Innovation-India, Mergers and Acquisitions-India, and Multi-Family Office and Wealth-India. India therefore includes both scaled and earlier-stage units, while the listed international BUs are either in specialised sales or product-building. Tracxn does not disclose revenue by BU, so the phase list is the available indicator of relative maturity.
The company’s Q2FY27 investor material also identified sales scale-up, specialised BU teams, expanded datasets and coverage, artificial-intelligence-native access to Tracxn data, product-led growth, and customer acquisition as key highlights. The presentation does not quantify the revenue contribution from those separate initiatives or specify which product-led-growth metrics changed during the quarter.
What is Tracxn’s international investment plan?
Tracxn says it is applying the India data-and-sales playbook to international BUs, which it characterises as being at an earlier stage. Management expects these investments to create a one-time cost step-up and to accelerate international growth over the coming quarters. The presentation does not report an international growth rate for Q2FY27 or quantify the expected cost increase.
Management says annual cost growth should subsequently fall to the low single digits, aided by artificial intelligence steadily reducing data-production costs. It says that cost path would put Tracxn on a route back to profitability. No target date for profitability, cost base, or margin target is given, so the timing and financial scale of the expected outcome remain unresolved.
Conclusion
Tracxn’s Q2FY27 disclosures show that India was both its majority revenue geography, at 53%, and its faster-growing reported geography, at 6.9% quarter on quarter. The Investment Banks-India case links that momentum to a sequence of specialised sales activity, product additions and an ongoing increase in selling capacity, with unit-level annualised revenue growth above 40% in Q2FY27.
The next disclosed milestones are whether Investment Banks-India reaches its planned 30 monthly new closures after recording 20 in Q1FY27, and whether Venture Capital Funds-India continues through sales scale-up. Management’s planned international investment, expected cost step-up, and expectation of low-single-digit annual cost growth thereafter will also determine whether the stated route back to profitability develops as outlined.