










Trident Lifeline consolidated borrowings rise to Rs 90 crore
Key highlights
- Trident Lifeline’s consolidated borrowings rose Rs 17 crore to Rs 90 crore in H1 FY27.
- Non-current borrowings increased Rs 14.5 crore to Rs 54.5 crore in H1 FY27.
- Capital work in progress rose Rs 3.5 crore to Rs 21 crore, while inventories increased Rs 7.9 crore to Rs 44.3 crore.
- Trident Lifeline generated Rs 11.5 crore of operating cash flow and used Rs 16.7 crore in investing activities in H1 FY27.
powered by IRIS
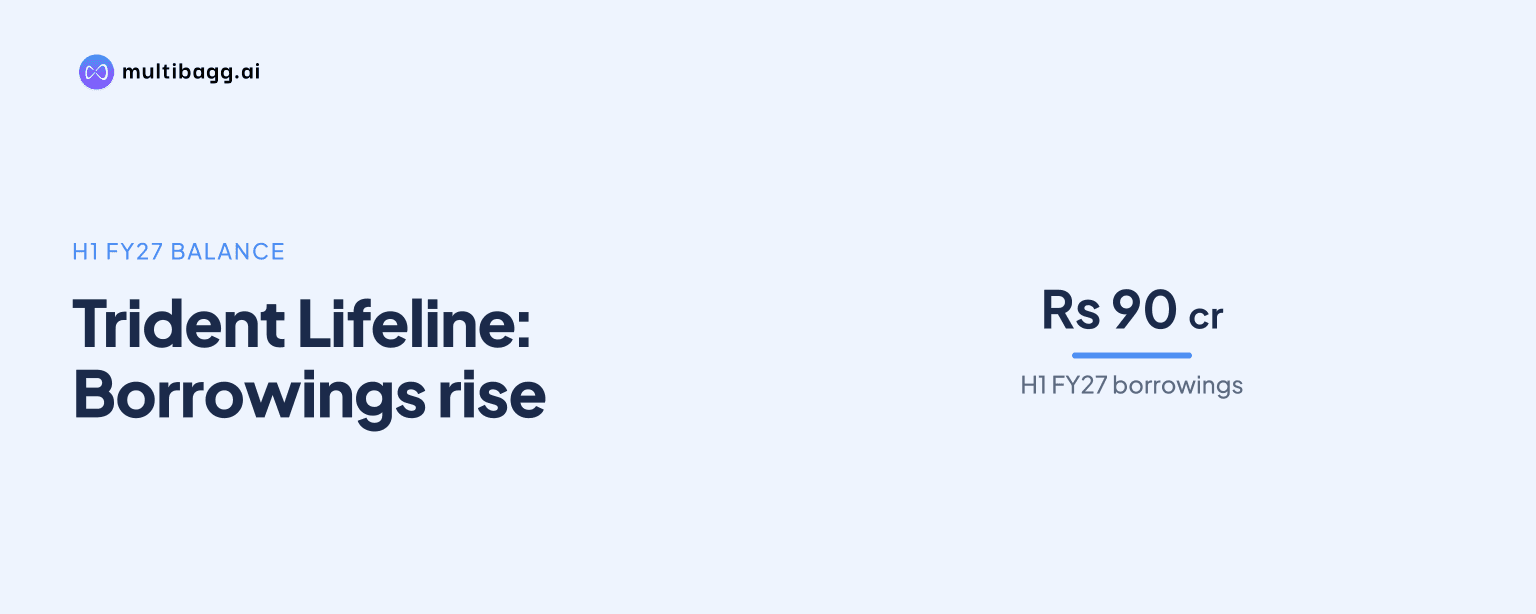
Trident Lifeline Limited reported consolidated borrowings of Rs 90 crore in H1 FY27, up Rs 17 crore from Rs 73 crore at FY26, as non-current borrowings rose Rs 14.5 crore to Rs 54.5 crore. Capital work in progress reached Rs 21 crore and inventories rose to Rs 44.3 crore during the same period.
Know Trident Lifeline inside out
Results, valuation, peers and who's buying, in one view.
Why did Trident Lifeline borrowings reach Rs 90 crore?
Trident Lifeline’s consolidated borrowings reached Rs 90 crore in H1 FY27 because non-current borrowings increased to Rs 54.5 crore from Rs 40 crore at FY26, while short-term borrowings increased to Rs 35.5 crore from Rs 33 crore. Non-current debt represented the larger part of the Rs 17 crore increase in aggregate borrowings.
The borrowing increase followed an earlier rise between FY25 and FY26, when total borrowings moved from Rs 54.1 crore to Rs 73 crore. Over H1 FY27, non-current borrowings rose by Rs 14.5 crore, compared with a Rs 2.5 crore increase in short-term borrowings.
The presentation does not identify individual loan facilities, repayment maturities, interest rates or the specific deployment of the additional borrowings. It records Rs 54.5 crore of non-current debt and Rs 35.5 crore of short-term debt at H1 FY27, compared with Rs 40 crore and Rs 33 crore, respectively, at FY26.
How did Trident Lifeline’s total liabilities change?
Trident Lifeline’s total consolidated liabilities rose by Rs 2 crore to Rs 130.9 crore in H1 FY27 from Rs 128.9 crore at FY26. This was smaller than the Rs 17 crore rise in borrowings because total current liabilities declined by Rs 12.5 crore to Rs 75.4 crore while non-current liabilities rose by Rs 14.5 crore to Rs 55.5 crore.
Trade payables provided the largest offset, falling by Rs 15.3 crore to Rs 23.1 crore in H1 FY27 from Rs 38.4 crore at FY26. Other current liabilities rose by Rs 0.6 crore to Rs 9.7 crore, while provisions declined by Rs 0.2 crore to Rs 7.2 crore.
Total shareholders’ equity increased by Rs 14.5 crore to Rs 118.7 crore from Rs 104.2 crore at FY26. Reserves and surplus grew Rs 13.6 crore to Rs 98.3 crore, minority interest increased Rs 1 crore to Rs 8.5 crore, and share application money pending allotment was Rs 3.6 crore, versus Rs 3.7 crore at FY26.
Which assets increased alongside Trident Lifeline’s borrowings?
Trident Lifeline’s non-current assets increased by Rs 16.7 crore to Rs 114 crore in H1 FY27 from Rs 97.3 crore at FY26. The movement included a Rs 3.5 crore increase in capital work in progress to Rs 21 crore, a Rs 7.7 crore increase in non-current investments to Rs 15.9 crore, and a Rs 3.1 crore increase in intangible assets including goodwill to Rs 21.3 crore.
Inventories rose by Rs 7.9 crore to Rs 44.3 crore in H1 FY27 from Rs 36.4 crore at FY26. Other current assets increased Rs 4.7 crore to Rs 13.3 crore, while trade receivables declined Rs 12.5 crore to Rs 61.2 crore, leaving total current assets marginally lower at Rs 139.2 crore versus Rs 139.5 crore.
Total consolidated assets increased by Rs 16.4 crore to Rs 253.2 crore in H1 FY27 from Rs 236.8 crore at FY26. Tangible assets were nearly unchanged at Rs 42.4 crore, against Rs 42.6 crore at FY26, while cash and cash equivalents remained Rs 4.2 crore in both periods.
Got a follow-up? Ask IRIS
What does Trident Lifeline’s cash flow show about funding?
Trident Lifeline generated Rs 11.5 crore of net cash from operating activities in H1 FY27 and used Rs 16.7 crore in investing activities. Net cash from financing activities was Rs 5.2 crore, leaving the reported net change in cash at Rs 0.0 crore for the half year.
The H1 FY27 cash-flow pattern differed from FY26, when operating cash flow was Rs 4.7 crore, investing cash outflow was Rs 36.6 crore and financing cash inflow was Rs 33.7 crore. FY26 ended with a Rs 1.8 crore net increase in cash, while cash and cash equivalents were Rs 4.2 crore at both FY26 and H1 FY27.
The financing cash-flow figure cannot be equated directly with the Rs 17 crore rise in borrowings because the presentation reports financing activities as an aggregate. Similarly, the cash-flow statement does not allocate the Rs 16.7 crore H1 FY27 investing outflow between capital work in progress, investments and other assets.
How did Trident Lifeline’s finance cost and earnings move?
Trident Lifeline’s consolidated finance cost was Rs 1.9 crore in Q2 FY27, compared with Rs 1 crore in Q2 FY26 and Rs 0.9 crore in Q1 FY27. The presentation reports the movements as a 95% year-on-year increase and a 125% quarter-on-quarter increase, but does not provide a separate H1 FY27 finance-cost total.
Consolidated revenue from operations rose 50% year on year to Rs 47.1 crore in Q2 FY27. Earnings before interest, tax, depreciation and amortisation, or EBITDA, increased 65% to Rs 11.3 crore, and the EBITDA margin rose 217 basis points to 24.1% from 21.9% in Q2 FY26.
Profit after tax increased 30% to Rs 6.6 crore in Q2 FY27 from Rs 5.1 crore a year earlier. Profit after tax margin declined to 14.0% from 16.2%, while depreciation and amortisation increased 71% to Rs 1.6 crore and other income declined 42% to Rs 1 crore.
Conclusion
Trident Lifeline’s H1 FY27 balance sheet records Rs 90 crore of consolidated borrowings, Rs 17 crore above FY26, alongside Rs 16.4 crore growth in total assets. The principal borrowing movement was the Rs 14.5 crore increase in non-current debt, while capital work in progress, investments, intangible assets and inventories also increased.
The next disclosures should be watched for detail on the Rs 54.5 crore of non-current borrowings and Rs 35.5 crore of short-term borrowings, as the presentation does not disclose facility terms or specific end uses. The relationship between the Rs 11.5 crore H1 FY27 operating cash inflow, Rs 16.7 crore investing outflow and Rs 1.9 crore Q2 FY27 finance cost is also relevant for subsequent reporting.