










TSF Investments Limited Q2 Profit Rises 49% to ₹153 Crore
Key highlights
- TSF Investments reported consolidated Q2 FY27 net profit of ₹153 crore, up 48.7% year on year.
- Consolidated Q2 FY27 sales increased 26.8% to ₹317 crore from ₹250 crore a year earlier.
- Operating profit margin improved 132 basis points year on year to 21.3%.
- EPS rose 49.3% year on year to ₹6.75 in Q2 FY27.
powered by IRIS
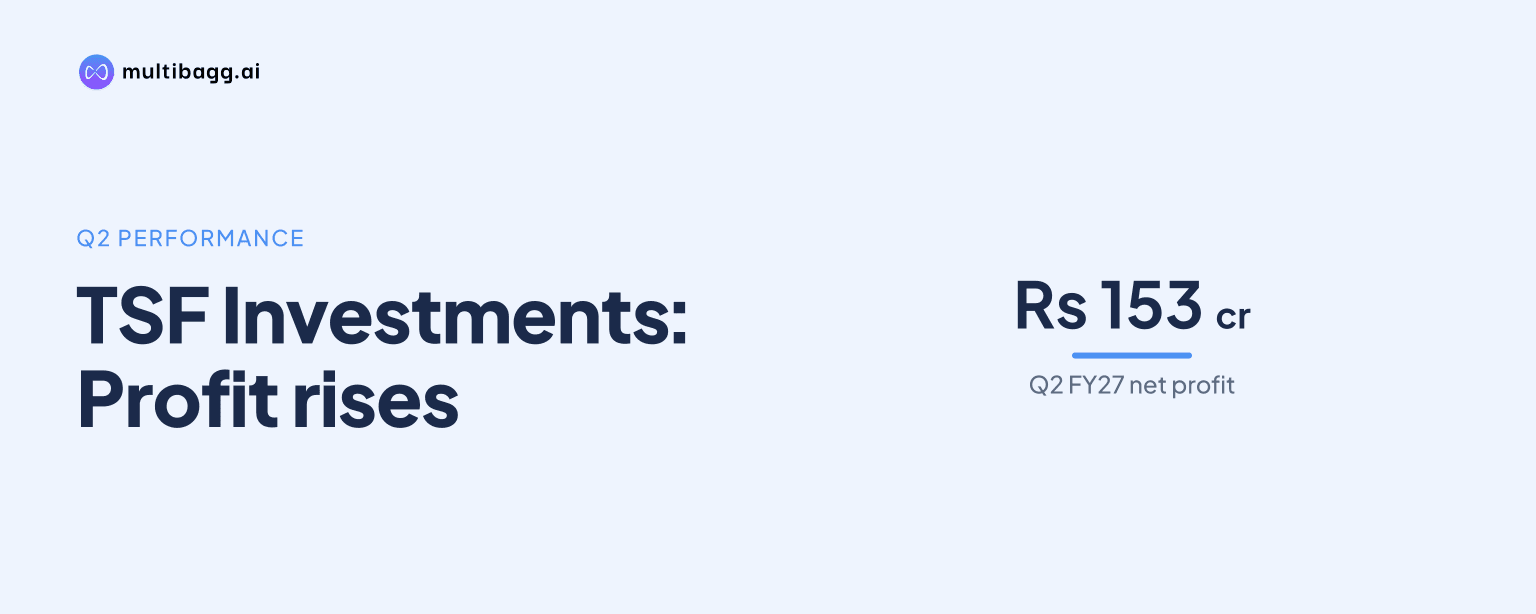
TSF Investments Limited reported consolidated net profit of ₹153 crore for Q2 FY27, up 48.7% year on year from ₹103 crore, as sales increased 26.8% to ₹317 crore in the quarter ended September 2026. The result matters because it followed a profit decline in the preceding June quarter despite strong revenue growth.
Know Tsf Investments inside out
Results, valuation, peers and who's buying, in one view.
What did TSF Investments report for Q2 FY27?
TSF Investments reported consolidated sales of ₹317 crore for the July-September 2026 quarter, compared with ₹250 crore in the year-earlier period. Operating profit rose 35.2% year on year to ₹67.6 crore from ₹50 crore, while consolidated net profit increased to ₹153 crore from ₹103 crore.
The company’s operating profit margin improved by 132 basis points year on year to 21.3%, from 20.0% in Q2 FY26. Net profit margin expanded to 48.3% from 41.2%, an increase of 710 basis points. Earnings per share rose 49.3% to ₹6.75, compared with ₹4.52 a year earlier.
The quarter-on-quarter comparison showed a different operating pattern. Sales were 3.8% higher than ₹306 crore in the June 2026 quarter, and net profit increased 22.6% from ₹125 crore. However, operating profit declined 5.1% from ₹71.3 crore and operating margin fell 200 basis points from 23.3%.
How did the September-quarter result unfold?
TSF Investments’ board was scheduled to consider the Q2 FY27 financial results on November 11, 2026, according to its November 4 exchange filing. The company was among 118 companies scheduled to announce September-quarter earnings on the day.
The reported consolidated figures show that profit growth outpaced sales growth on a year-on-year basis. The supplied results data also indicated that profit was 28% above the company’s own trend, while operating margin expanded from the comparable quarter last year.
The company’s performance needs to be viewed separately at consolidated and standalone levels. An AI read of the filing cited standalone profit after tax of ₹37.76 crore for the quarter ended September 30, 2026, up 59.9% from ₹23.62 crore a year earlier, and referred to ₹822.51 crore reaped from the TVS Holdings stake. The headline quarterly figures of sales, operating profit and ₹153 crore net profit are consolidated figures.
This distinction is important for investors because standalone and consolidated earnings cover different reporting scopes. The available data does not provide a detailed reconciliation between the standalone profit figure and the consolidated net profit shown in the quarterly summary.
How does Q2 compare with TSF Investments’ previous quarter?
TSF Investments’ Q2 result marked a recovery in consolidated profit compared with the immediately preceding quarter. In Q1 FY27, covering April-June 2026, the company reported sales of ₹306 crore, up 70.9% year on year, but net profit fell 20.9% to ₹125 crore from ₹158 crore.
The September-quarter sales figure of ₹317 crore was higher than the June-quarter figure, extending the revenue growth reported in the prior period. Yet, operating profit declined to ₹67.6 crore from ₹71.3 crore, and the operating margin narrowed to 21.3% from 23.3% sequentially. This means the quarter’s higher net profit was not accompanied by a sequential rise in operating profit.
Historical quarterly data supplied for TSF Investments show net sales turnover of ₹305.58 crore in June 2026, ₹297.57 crore in March 2026 and ₹250.06 crore in September 2025. Operating profit was ₹71.27 crore, ₹57.32 crore and ₹50.47 crore, respectively, in those periods. The latest reported sales of ₹317 crore are above those earlier quarterly levels.
For the full FY26, TSF Investments reported net profit of ₹530 crore. The current Q2 numbers provide a quarterly update, while the supplied information does not state a management target or outlook for the rest of FY27.
Got a follow-up? Ask IRIS
What do the Q2 figures mean for TSF Investments investors?
TSF Investments’ Q2 data show year-on-year growth across sales, operating profit, net profit and earnings per share. The 48.7% increase in consolidated net profit and the 710-basis-point improvement in net profit margin are the most notable changes in the reported quarterly summary.
At the same time, the sequential decline in operating profit and operating margin remains relevant. Sales increased from the June quarter, but operating profit was lower and other income of ₹2.9 crore was below ₹4.0 crore in the September 2025 quarter, though higher than ₹0.7 crore in June 2026.
The supplied market data placed TSF Investments’ market capitalisation at ₹9,497 crore and its price-to-earnings ratio at 17.4. Another results-season dashboard listed market value at ₹9,082 crore, indicating that the figures were captured at different times. Investors should therefore treat the market-value references as time-specific rather than directly comparable with the quarterly financial data.
The company operates in the investment and holding companies segment. For such businesses, investors typically need to distinguish operating performance from income linked to investments or holdings, particularly where standalone and consolidated financial statements show different profit figures.
Why are margins and reporting scope important in this result?
TSF Investments’ year-on-year operating-margin expansion to 21.3% indicates that operating profit rose faster than sales compared with Q2 FY26. But the sequential 200-basis-point margin decline shows that the improvement versus last year did not continue from the June-quarter level.
The gap between the standalone PAT cited in the filing summary and the consolidated net profit in the quarterly data also makes reporting scope central to reading the result. Consolidated financials include the group-level position, while standalone results relate to the reporting entity. The available information identifies both figures but does not provide all underlying components needed to compare them line by line.
For the broader market, the announcement came during a busy Q2 FY27 earnings day that also included Tata Power, Hindustan Copper, Garden Reach Shipbuilders & Engineers, Triveni Turbine, Mishra Dhatu Nigam and National Fertilizers. Company-specific earnings, rather than the reporting calendar alone, remain the relevant basis for assessing TSF Investments’ reported performance.
Conclusion
TSF Investments delivered higher consolidated sales and a 48.7% year-on-year increase in Q2 FY27 net profit to ₹153 crore. The results also showed stronger year-on-year operating and net profit margins, although operating profit and operating margin eased from the June 2026 quarter.
The next point to watch is whether sales growth translates into a renewed sequential increase in operating profit and margin in subsequent filings. Investors will also need to monitor future disclosures for greater clarity on the relationship between standalone earnings, including the TVS Holdings stake reference, and consolidated results.