










UFO multiplexes accounted for 66% of Q2FY26 screens
Key highlights
- UFO had 2,606 multiplex screens out of 3,946 advertising screens in Q2FY26, or about 66%.
- Other cities and towns contained 1,487 of UFO’s 2,606 multiplex screens in Q2FY26.
- UFO’s in-cinema advertising revenue increased 17% to Rs 70 crore in H1FY27.
- Corporate and hyperlocal customers supplied 80% of UFO’s H1FY27 in-cinema advertising revenue.
powered by IRIS
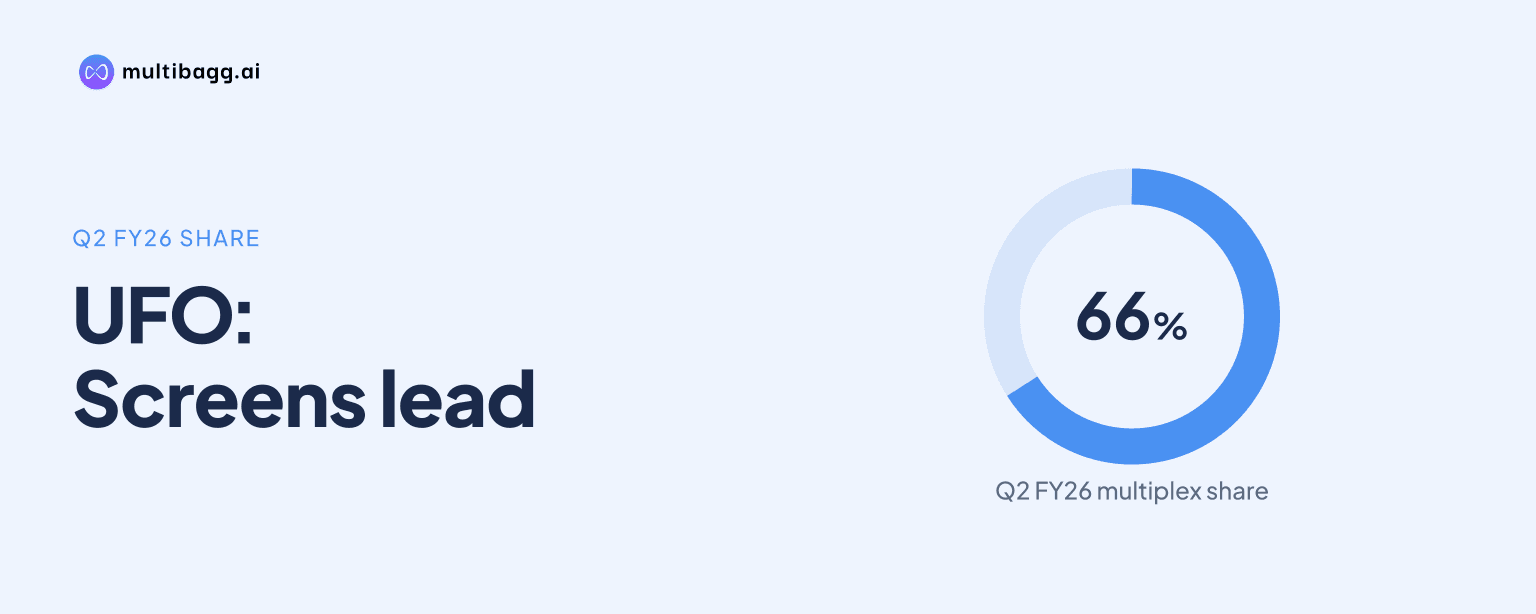
UFO Cine Media Network reported 2,606 multiplex screens out of 3,946 advertising screens in Q2FY26, meaning multiplexes represented about 66% of the network. The disclosed base also included 1,340 single screens and annualised full-house seating capacity of about 1.8 billion seats, calculated using four shows daily.
Know UFO Moviez India inside out
Results, valuation, peers and who's buying, in one view.
How large was UFO’s multiplex advertising network in Q2FY26?
UFO’s multiplex advertising network comprised 2,606 screens in Q2FY26, compared with 1,340 single screens, for a total of 3,946 screens. The multiplex count was 1,266 higher than the single-screen count and represented approximately two-thirds of the disclosed advertising network. The single-screen total included 393 premium single screens.
UFO split its multiplex base between 1,119 screens in Metro and Tier I locations and 1,487 screens in other cities and towns. Metro and Tier I locations are defined in the presentation as cities and towns with populations above 1.5 million. Other cities and towns also contained 1,053 single screens, versus 287 single screens in Metro and Tier I locations.
Does UFO disclose an FY15 multiplex-screen share?
No, the supplied presentation does not disclose an FY15 multiplex-screen count, total advertising-screen count or multiplex share for UFO. It provides the Q2FY26 operating snapshot of 2,606 multiplexes and 1,340 single screens, but no FY15 baseline from which a 22% share or a long-term change can be verified.
The Q2FY26 figures establish that multiplexes were the larger part of the current 3,946-screen base, but the presentation does not provide a prior-period screen-mix schedule. It also does not disclose additions, closures or conversions between FY15 and Q2FY26. As a result, the stated historical comparison remains unresolved within the supplied pages.
How did UFO’s multiplex and single-screen capacities differ?
UFO’s multiplex screens had lower seating capacity per screen per show than single screens in both disclosed geographic categories in Q2FY26. Metro and Tier I multiplexes had 235 seats per screen per show, against 559 for single screens. In other cities and towns, multiplexes had 225 seats per screen per show, compared with 436 for single screens.
The four categories together had annualised full-house seating capacity of about 1.8 billion seats. Other cities and towns single screens had the largest category capacity at 661 million annualised seats, followed by multiplexes in other cities and towns at 482 million. Metro and Tier I multiplexes represented 378 million seats, while Metro and Tier I single screens represented 231 million seats.
UFO calculates annualised full-house capacity by multiplying full-house seating capacity per show by four shows a day, 30 days a month and 12 months a year. The underlying capacity per show was 334,753 seats for multiplexes in other cities and towns and 262,829 for Metro and Tier I multiplexes. The comparable single-screen figures were 459,337 and 160,306 seats per show.
Got a follow-up? Ask IRIS
What was UFO’s in-cinema advertising client mix?
UFO’s in-cinema advertising revenue remained led by corporate and hyperlocal customers, which supplied 81% of Rs 33.4 crore in Q2FY27 and 80% of Rs 70 crore in H1FY27. Government and public-sector undertaking, or PSU, customers contributed the remaining 19% in Q2FY27 and 20% in H1FY27. These percentages describe revenue by customer category rather than the allocation of advertising screens.
In Q2FY27, corporate and hyperlocal in-cinema revenue rose 3% to Rs 27.2 crore from Rs 26.4 crore in Q2FY26. Government and PSU revenue rose 4% to Rs 6.2 crore from Rs 6 crore. Total in-cinema advertising revenue increased 3% to Rs 33.4 crore from Rs 32.3 crore.
For H1FY27, in-cinema advertising revenue increased 17% to Rs 70 crore from Rs 59.7 crore in H1FY26. Corporate and hyperlocal revenue rose 15% to Rs 55.7 crore, while government and PSU revenue increased 29% to Rs 14.3 crore. Caravan advertising declined to Rs 70 lakh from Rs 1.8 crore, leaving total advertisement revenue at Rs 70.7 crore, up from Rs 61.5 crore.
How did UFO’s advertising monetisation measures change?
UFO reported average advertising revenue per screen of Rs 85,142 in Q2FY27, compared with Rs 85,526 in Q2FY26. Average minutes sold per show per advertising screen were unchanged at 4.55 minutes in both quarters. In-cinema advertising revenue nevertheless increased to Rs 33.4 crore from Rs 32.3 crore over the same comparison.
For H1FY27, average advertising revenue per screen rose to Rs 1.75 lakh from Rs 1.57 lakh in H1FY26. Average minutes sold per show declined to 4.29 from 4.41 minutes. UFO defines the average number of advertising screens as the average of opening and closing advertising-screen counts during the period.
Advertisement sharing with exhibitors was 54.07% in Q2FY27, down from 54.95% in Q2FY26. For H1FY27, the share was 56.48%, compared with 60.70% in H1FY26. The half-year reduction occurred alongside the 17% increase in in-cinema advertising revenue to Rs 70 crore.
Conclusion
UFO’s Q2FY26 operating data shows that multiplexes represented about 66% of its 3,946 advertising screens, with 1,487 multiplexes located in other cities and towns and 1,119 in Metro and Tier I markets. Although multiplexes formed the larger screen base, single screens retained higher seating capacity per screen per show in both geographic categories.
The next disclosed measures to watch are advertising revenue per screen, minutes sold per show and revenue sharing with exhibitors. In H1FY27, revenue per screen rose to Rs 1.75 lakh while sold minutes fell to 4.29 and exhibitor sharing declined to 56.48%; the supplied material provides no future screen-mix target or FY15 baseline.