










US Dollar-Indian Rupee Rate at 92.68 Below Key Averages
Key highlights
- USD/INR closed at 92.68 on 20 November 2026, 4.3% below its 96.88 closing high of 22 July.
- USD/INR stayed below its 50-day average of 95.13 and 200-day average of 94.64 from 5 November.
- USD/INR declined from 94.24 on 13 November to about 92.68 on 20 and 21 November, a move of more than 1.6%.
- The 94.60-95.00 zone combines November resistance with the 200-day and nearby 50-day averages.
powered by IRIS
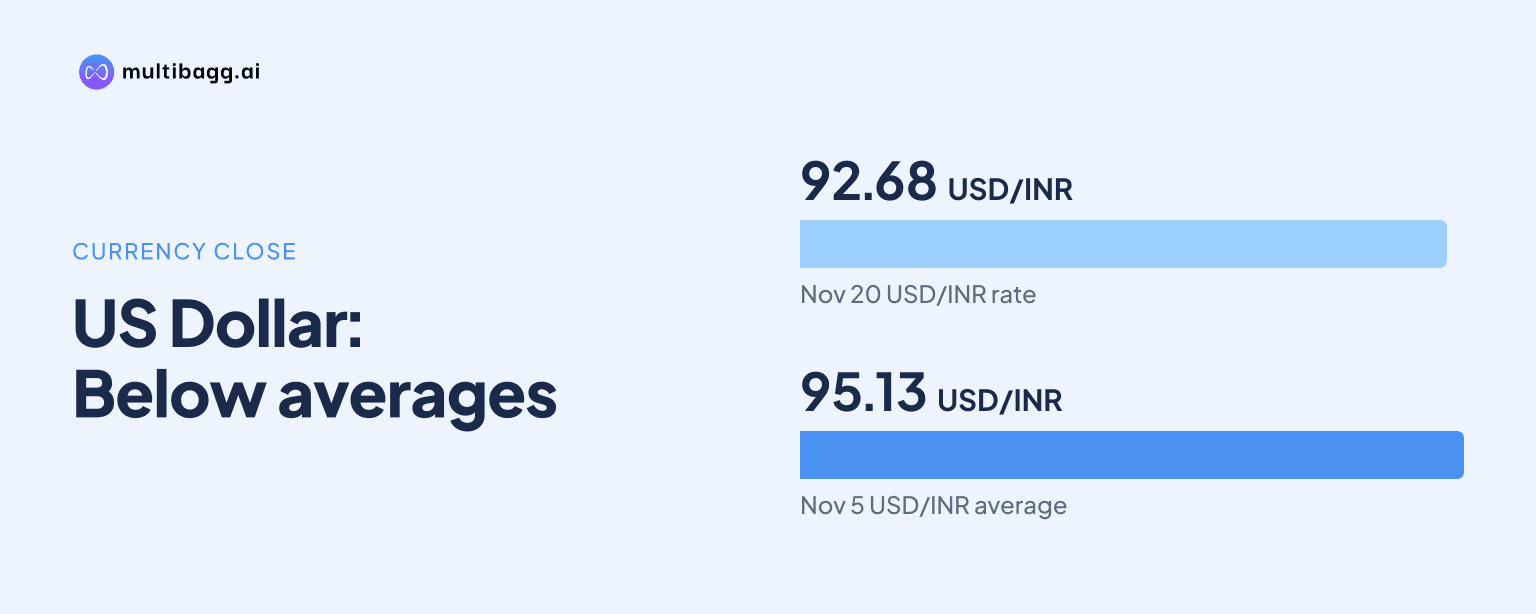
The US Dollar-Indian Rupee Rate closed at 92.68 on 20 November 2026, 4.3% below its 96.88 closing high of 22 July and below its 50-day and 200-day moving averages. USD/INR has remained beneath both longer-term trend measures every day since 5 November, pointing to weaker near-term momentum after a five-year climb.
Why is USD/INR below its key moving averages?
USD/INR is below its key moving averages because its 92.68 close was under the 50-day average of 95.13 and the 200-day average of 94.64. The pair has also stayed below both measures since 5 November, a change from the preceding uptrend when prices generally held above these lines.
Moving averages are backward-looking tools rather than forecasts or trading signals. Still, the sustained position below both measures matters because it indicates that recent prices have remained weaker than the average levels over the past 50 and 200 sessions. Social-media discussion has focused on whether this persistence marks a loss of momentum in the dollar's long rise against the rupee.
What does the fall from the July high show?
The fall from the July high shows that USD/INR has retreated 4.3% from 96.88 on 22 July 2026 to 92.68 on 20 November. The exchange rate had risen from about 74 in late 2021 to that July closing high, making the latest pullback notable against the longer five-year advance.
The move accelerated in the latest five sessions cited in the discussion. USD/INR moved from 94.24 on 13 November to about 92.68 on 20 and 21 November, a rupee gain of more than 1.6%. The 20 November session alone saw the rupee gain 65 paise, taking USD/INR below 93 for the first time in more than seven months, according to the shared market data.
Which USD/INR levels are investors watching?
Investors are watching 94.60 to 95.00 as the main resistance zone, with 91.40 and 88.60 as lower reference levels if USD/INR stays below that range. Traders reportedly saw repeated stalls around 94.50 to 94.60 during November, while the zone also contains the 200-day average at 94.64 and sits close to the 50-day average at 95.13.
The 94.60-95.00 area is therefore the technical line that would challenge the current interpretation. A recovery above 95.00 would weaken the view that the pair's long rally is losing steam. Conversely, continued closes below the moving averages would keep attention on the lower historical ranges rather than establish a guaranteed path to them.
Got a follow-up? Ask IRIS
What could make the rupee's gains uneven?
The rupee's gains could be uneven because RBI reserve-building and importer dollar demand can trigger sharp USD/INR rebounds. The discussion explicitly cautions against assuming a straight decline in the pair, even after its recent weakness below the principal moving averages.
Reported foreign portfolio inflows, softer crude oil prices and reduced spot-dollar demand were cited as factors supporting the rupee around the 20 November close. However, broader trade and inflation pressures remain relevant in the shared commentary. Analysts cited online placed the near-term range at 92.40 to 93.00, while Goldman Sachs was reported to expect about 94 in the next quarter.
How should moving-average signals be interpreted?
Moving-average signals should be interpreted as evidence of recent price behaviour, not as a prediction for USD/INR. The pair was also reported below its 20-day average, reinforcing the short-term weakness seen below the 50-day and 200-day measures, but these indicators only summarise prior daily prices.
The data discussed uses daily and weekly USD/INR reference rates through the 20 November close, with anomalous single-day prints more than 2.5% away from surrounding days excluded. Market participants should also distinguish between the market exchange rate and an official fixing rate. The technical case needs confirmation through additional closes rather than relying on a few sessions of rupee strength.
Conclusion
USD/INR's close at 92.68 combines a 4.3% retreat from July's 96.88 high with a sustained break below its 50-day and 200-day averages. That combination supports the view that the previous dollar rally has weakened in the near term, while the recent five-session rupee advance has strengthened attention on lower reference levels.
The next point to watch is whether USD/INR remains below 94.60-95.00, the area defined by November's failed rallies and the longer-term averages. Investors will also track the cited 92.40-93.00 near-term range, foreign portfolio flows, crude prices, importer demand and any RBI reserve-building that could produce a rebound.