










Visaka FY26 recovery lifts operating cash flow to Rs 183 crore
Key highlights
- Visaka’s FY26 revenue increased to Rs 1,678 crore from Rs 1,543 crore in FY25.
- Visaka’s FY26 EBITDA rose to Rs 139 crore from Rs 99 crore, and EBITDA margin increased to 8.3% from 6.4%.
- Visaka generated Rs 183 crore of net cash from operating activities in FY26, compared with Rs 114 crore in FY25.
- Visaka’s combined borrowings declined to Rs 303 crore at FY26-end from Rs 479 crore at FY25-end.
powered by IRIS
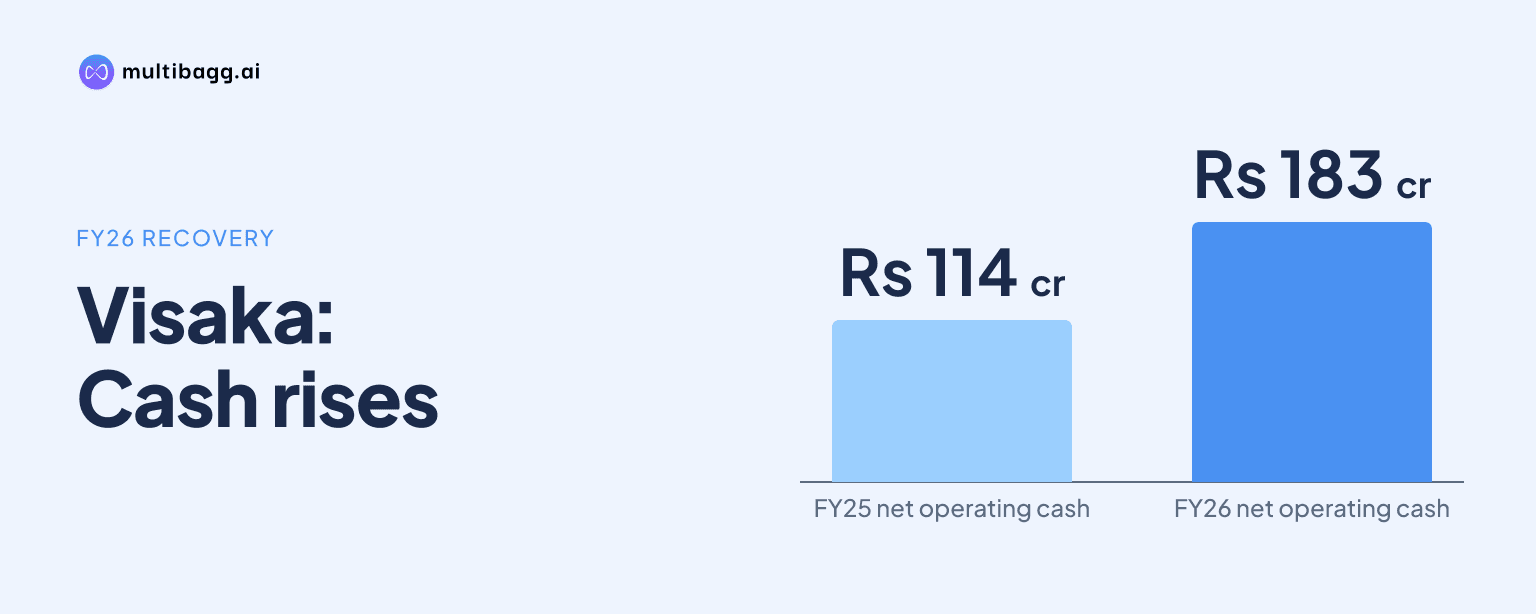
Visaka Industries Limited lifted net cash from operating activities to Rs 183 crore in FY26, as revenue reached Rs 1,678 crore, EBITDA rose to Rs 139 crore and total borrowings fell to Rs 303 crore from Rs 479 crore at FY25-end. Reported profit after tax was Rs 85 crore, compared with a Rs 3 crore loss in FY25.
Know Visaka Industries inside out
Results, valuation, peers and who's buying, in one view.
What changed in Visaka’s FY26 earnings?
Visaka returned to reported profitability in FY26, recording profit after tax of Rs 85 crore against a Rs 3 crore loss in FY25. Revenue increased by Rs 135 crore to Rs 1,678 crore, while earnings before interest, tax, depreciation and amortisation, or EBITDA, rose by Rs 40 crore to Rs 139 crore. Profit before tax moved to Rs 107 crore from a Rs 2 crore loss.
The presentation separately reports profit after tax before exceptional items of Rs 38 crore in FY26, with a 2.3% margin, compared with a 0.2% loss margin in FY25. Its consolidated profit and loss statement records Rs 60 crore of exceptional items in FY26 and shows a reported profit-after-tax margin of 5.1%, against negative 0.2% in FY25.
How did Visaka’s margins improve in FY26?
Visaka’s gross profit margin increased to 47.5% in FY26 from 45.2% in FY25, while gross profit rose by Rs 98 crore to Rs 796 crore. Raw-material expense increased by Rs 37 crore to Rs 882 crore, compared with the Rs 135 crore increase in revenue. Employee expense rose to Rs 143 crore from Rs 136 crore, and other expenses increased to Rs 513 crore from Rs 463 crore.
Visaka’s EBITDA margin improved by 1.9 percentage points to 8.3% in FY26 from 6.4% in FY25. Earnings before interest and tax increased to Rs 80 crore from Rs 42 crore, taking its margin to 4.8% from 2.8%. Finance cost declined to Rs 33 crore from Rs 44 crore, while depreciation was unchanged at Rs 65 crore in both years.
What was Visaka’s FY26 revenue mix?
Visaka’s Building Materials segment, including ATUM, accounted for 84% of FY26 revenue, while Synthetic Yarn accounted for 16%. Building Materials remained the larger business, although its share declined by 2 percentage points from 86% in FY25. Synthetic Yarn’s share increased by 2 percentage points from 14% in FY25.
Visaka’s FY26 revenue of Rs 1,678 crore was above the Rs 1,653 crore reported in FY23, Rs 1,527 crore in FY24 and Rs 1,543 crore in FY25. EBITDA recovered from Rs 99 crore in FY25 to Rs 139 crore in FY26, but remained below Rs 200 crore in FY22. The FY26 EBITDA margin of 8.3% was also below 14.1% in FY22 and marginally below 8.4% in FY23.
Got a follow-up? Ask IRIS
How did Visaka deleverage and improve operating returns in FY26?
Visaka reduced total borrowings to Rs 303 crore at FY26-end from Rs 479 crore at FY25-end, based on the combined current and non-current borrowing balances in its consolidated balance sheet. Non-current borrowings declined by Rs 52 crore to Rs 116 crore, while current borrowings fell by Rs 124 crore to Rs 187 crore. Total assets decreased by Rs 74 crore to Rs 1,349 crore.
Visaka’s total equity increased to Rs 827 crore from Rs 745 crore, while non-current liabilities declined to Rs 129 crore from Rs 182 crore and current liabilities fell to Rs 393 crore from Rs 496 crore. Cash and cash equivalents increased to Rs 24 crore from Rs 16 crore. Inventories declined to Rs 352 crore from Rs 365 crore, and trade receivables declined to Rs 163 crore from Rs 188 crore.
Visaka’s return on capital employed, or ROCE, rose to 16.8% in FY26 from 9.2% in FY25, while return on equity, or ROE, increased to 9.1% from negative 0.8%. Fixed-assets turnover increased to 2.4 times from 2.1 times. ROCE and ROE nevertheless remained below FY22 levels of 43.4% and 32.3%, respectively.
Why did Visaka’s operating cash flow rise in FY26?
Visaka generated Rs 183 crore of net cash from operating activities in FY26, up Rs 69 crore from Rs 114 crore in FY25. Cash generated from operations increased to Rs 197 crore from Rs 113 crore. Operating profit before working-capital changes rose to Rs 151 crore from Rs 102 crore, and changes in working capital contributed Rs 47 crore compared with Rs 11 crore in FY25.
Visaka’s working-capital days fell to 151 in FY26 from 180 in FY25, returning to the FY23 level of 151 days and remaining below FY24’s 198 days. The cash-flow statement showed net cash from investing activities of Rs 35 crore in FY26, compared with an outflow of Rs 33 crore in FY25. Net cash used in financing activities was Rs 210 crore, versus Rs 100 crore in FY25.
Cash and cash equivalents increased by Rs 8 crore during FY26 after declining by Rs 19 crore in FY25. Opening cash and cash equivalents were Rs 16 crore in FY26, compared with Rs 35 crore at the start of FY25. The FY26 closing balance was Rs 24 crore, compared with Rs 16 crore at FY25-end.
Conclusion
Visaka’s FY26 figures combine higher revenue, wider operating margins, reported profitability and cash generation with lower borrowings. Revenue rose to Rs 1,678 crore, EBITDA margin increased to 8.3%, net cash from operating activities reached Rs 183 crore and combined borrowings declined by Rs 176 crore to Rs 303 crore. Building Materials, including ATUM, remained 84% of revenue, while Synthetic Yarn represented 16%.
What to watch next is the gap between reported and pre-exceptional earnings. Visaka reported Rs 85 crore of profit after tax in FY26, while its annual-performance table lists Rs 38 crore of profit after tax before exceptional items and the profit and loss statement records Rs 60 crore of exceptional items without a further breakdown in the supplied pages.