










VISDEM short-term borrowings reached Rs 27.64 crore in FY26
Key highlights
- VISDEM's FY26 short-term borrowings rose to Rs 27.64 crore from Rs 20.70 crore in FY25.
- VISDEM's FY26 inventories increased by Rs 9.95 crore to Rs 39.94 crore.
- VISDEM's total current liabilities reached Rs 43.50 crore in FY26, up from Rs 32.35 crore.
- VISDEM's FY26 finance costs rose to Rs 4.09 crore while net profit was Rs 7.77 crore.
powered by IRIS
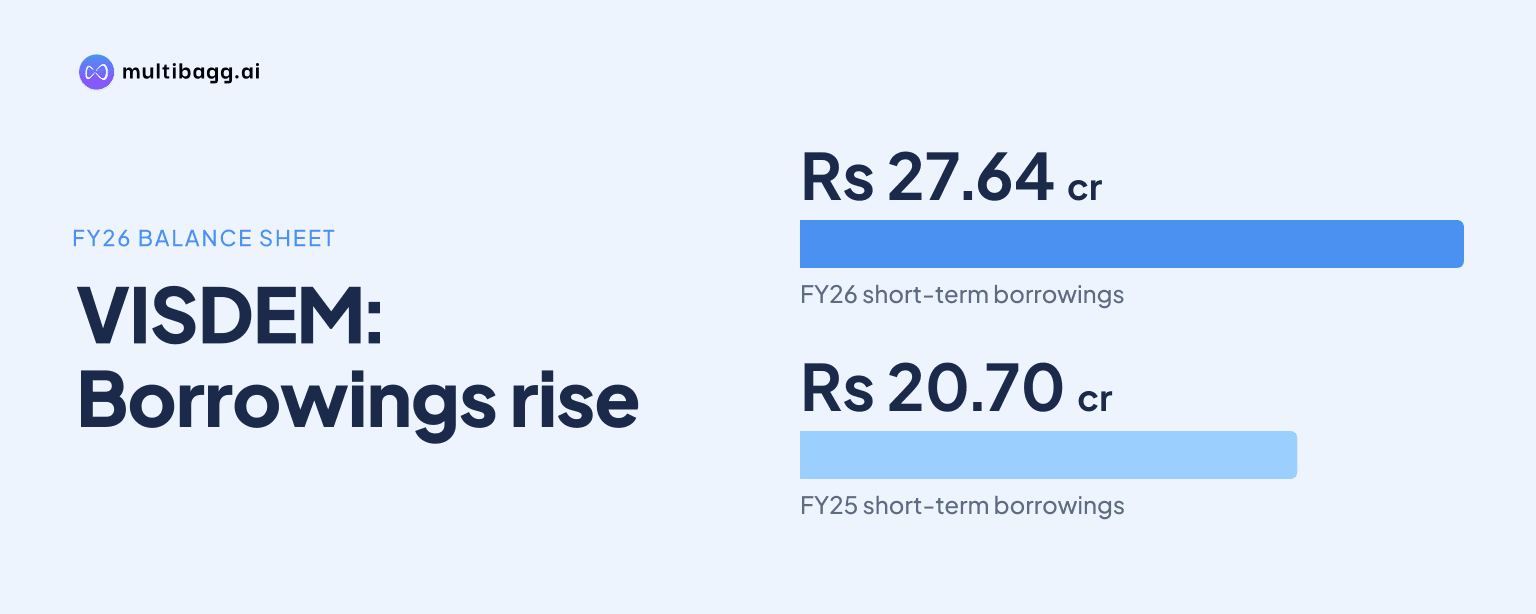
In FY26, Visdem Technosys Limited reported Rs 27.64 crore of short-term borrowings, while inventory reached Rs 39.94 crore and total current liabilities rose to Rs 43.50 crore. VISDEM’s short-term borrowings were Rs 6.94 crore higher than FY25, alongside a Rs 9.95 crore increase in inventory and a Rs 5.17 crore rise in trade receivables.
Know Visdem Technosys inside out
Results, valuation, peers and who's buying, in one view.
What drove VISDEM's FY26 short-term borrowing increase?
VISDEM’s short-term borrowings rose by Rs 6.94 crore to Rs 27.64 crore in FY26 from Rs 20.70 crore in FY25, following an earlier increase from Rs 12.09 crore in FY24. Over the two-year period, this current funding line increased by Rs 15.55 crore. The presentation does not identify the lenders, interest rates, repayment dates or specific end-use of these borrowings.
VISDEM’s short-term borrowing increase was the largest component of the Rs 11.15 crore year-on-year rise in total current liabilities, which reached Rs 43.50 crore in FY26. Trade payables to other creditors increased by Rs 4.28 crore to Rs 11.77 crore, while other current liabilities rose by Rs 0.86 crore to Rs 1.80 crore. Trade payables to micro and small enterprises declined by Rs 0.15 crore to Rs 0.99 crore.
How did VISDEM's inventory and receivables change in FY26?
VISDEM’s inventory increased by Rs 9.95 crore to Rs 39.94 crore in FY26 from Rs 29.99 crore in FY25, after rising from Rs 22.92 crore in FY24. Inventory was the largest current-asset category in FY26, exceeding trade receivables of Rs 14.04 crore and cash and cash equivalents of Rs 4.78 crore. Its Rs 17.02 crore increase over two years exceeded the Rs 15.55 crore increase in short-term borrowings over the same period.
Trade receivables rose by Rs 5.17 crore year on year to Rs 14.04 crore in FY26, compared with a Rs 0.60 crore increase in FY25. Other current assets increased by Rs 1.12 crore to Rs 2.48 crore, while short-term loans and advances fell by Rs 0.90 crore to Rs 9.48 crore. Together, these movements lifted total current assets by Rs 15.62 crore to Rs 70.72 crore in FY26.
How did VISDEM's current assets compare with current liabilities?
VISDEM had Rs 70.72 crore of current assets against Rs 43.50 crore of current liabilities in FY26, leaving Rs 27.22 crore after subtracting current liabilities from current assets. The equivalent calculated amount was Rs 22.75 crore in FY25, when current assets were Rs 55.10 crore and current liabilities were Rs 32.35 crore. The FY26 increase in current assets therefore exceeded the increase in current liabilities in absolute rupee terms.
The composition of current assets changed in FY26 because inventory represented Rs 39.94 crore of the Rs 70.72 crore total, compared with Rs 29.99 crore of Rs 55.10 crore in FY25. Cash and cash equivalents increased by Rs 0.29 crore to Rs 4.78 crore, while receivables added Rs 5.17 crore. The presentation provides year-end balances but does not give inventory turnover, receivable collection days or ageing data for either balance.
Got a follow-up? Ask IRIS
How did VISDEM's fixed assets and longer-term funding change?
VISDEM’s total assets increased by Rs 18.75 crore to Rs 99.85 crore in FY26, with non-current assets rising by Rs 3.13 crore to Rs 29.13 crore. Property, plant and equipment increased by Rs 1.63 crore to Rs 23.52 crore, while capital work-in-progress rose by Rs 1.29 crore to Rs 2.77 crore. The balance sheet does not connect individual borrowings to particular assets.
Long-term borrowings declined by Rs 0.19 crore to Rs 7.41 crore in FY26, contrasting with the Rs 6.94 crore increase in short-term borrowings. Shareholders’ funds increased by Rs 7.64 crore to Rs 47.99 crore, as reserves and surplus rose from Rs 30.08 crore to Rs 37.72 crore while share capital remained Rs 10.27 crore. The presentation also reports a 1,40,000 square foot plant consolidation in November 2024 and installed capacity of 530 lakh metres per annum.
What did VISDEM's FY26 earnings show alongside higher working-capital balances?
VISDEM reported FY26 revenue from operations of Rs 105.15 crore, up Rs 6.95 crore from Rs 98.20 crore in FY25, while earnings before interest, tax, depreciation and amortisation, excluding other income, increased by Rs 1.06 crore to Rs 16.38 crore. The reported EBITDA margin was 15.58%, marginally below 15.60% in FY25. Raw-material or material-consumption cost rose by Rs 1.85 crore to Rs 70.90 crore and other expenses increased by Rs 2.85 crore to Rs 16.91 crore.
Finance costs rose by Rs 1.06 crore to Rs 4.09 crore in FY26 as short-term borrowings increased to Rs 27.64 crore, although the presentation does not state that one caused the other. Profit before tax declined by Rs 0.14 crore to Rs 10.39 crore, while net profit was broadly unchanged at Rs 7.77 crore against Rs 7.76 crore in FY25. Net profit margin declined to 7.39% from 7.90%, even as total income increased by Rs 6.80 crore to Rs 105.45 crore.
Conclusion
VISDEM’s FY26 balance sheet combined Rs 39.94 crore of inventory, Rs 14.04 crore of receivables and Rs 27.64 crore of short-term borrowings within total assets of Rs 99.85 crore. Current assets rose by Rs 15.62 crore during FY26, exceeding the Rs 11.15 crore increase in current liabilities, while EBITDA increased by Rs 1.06 crore.
The next disclosures to watch are those addressing the Rs 9.95 crore FY26 inventory increase, the Rs 6.94 crore rise in short-term borrowings and finance costs of Rs 4.09 crore. VISDEM identifies the November 2024 plant consolidation and 530 lakh metres of annual installed capacity, but the presentation provides no working-capital target, borrowing-reduction plan or debt-maturity schedule.