










VST H1 revenue rises 6% while operating EBITDA margin falls
Key highlights
- VST reported H1 FY27 revenue of Rs 635 crore, up 6% from Rs 597.6 crore.
- VST’s H1 FY27 operating EBITDA fell by Rs 3 crore to Rs 75.4 crore, while margin declined to 12% from 13%.
- VST reported a Q2 FY27 operating EBITDA margin of 11%, compared with 13% in Q2 FY26.
- VST’s H1 FY27 power-tiller volume rose 9% to 27,158 units and power-weeder volume rose 22% to 6,076 units.
powered by IRIS
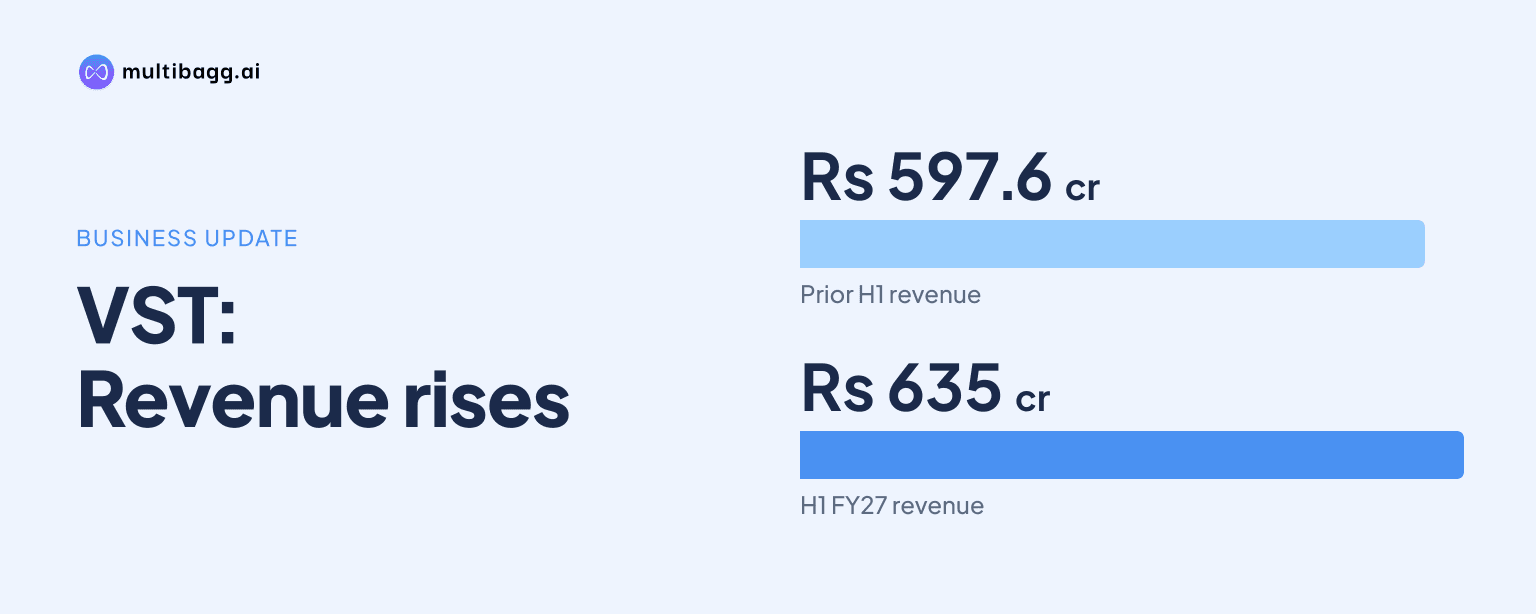
VST Tillers & Tractors Ltd. reported H1 FY27 revenue of Rs 635 crore, up 6% year on year, but operating EBITDA fell to Rs 75.4 crore from Rs 78.4 crore and its margin declined to 12% from 13%, according to its first-half financial presentation.
Know VST Tillers Tractors inside out
Results, valuation, peers and who's buying, in one view.
Why did VST’s H1 operating EBITDA margin decline?
VST’s H1 operating EBITDA margin declined because operating EBITDA decreased despite higher revenue. Revenue rose by Rs 37.4 crore to Rs 635 crore in H1 FY27 from Rs 597.6 crore in H1 FY26, while operating EBITDA fell by Rs 3 crore to Rs 75.4 crore from Rs 78.4 crore. The reported operating EBITDA margin was 12%, compared with 13% a year earlier.
Operating EBITDA means earnings before interest, tax, depreciation and amortisation, measured by VST excluding other income and fair-value gain or loss. The presentation does not provide a cost breakdown, pricing information or management explanation for the H1 FY27 margin movement, so it does not establish what caused operating EBITDA to decline while revenue increased.
How did VST’s Q2 FY27 profitability compare with last year?
VST’s Q2 FY27 profitability was lower than in Q2 FY26, with operating EBITDA declining to Rs 35.1 crore from Rs 40.9 crore and the operating EBITDA margin falling to 11% from 13%. Revenue increased 2% to Rs 321.6 crore from Rs 315.1 crore, matching the first-half pattern of revenue growth alongside lower operating EBITDA.
The Rs 5.8 crore Q2 operating EBITDA reduction was larger than the Rs 3 crore H1 reduction. Profit after tax fell by Rs 2.6 crore to Rs 22.8 crore in Q2 FY27 from Rs 25.4 crore in Q2 FY26, unlike the H1 comparison, in which profit after tax increased to Rs 71.5 crore. VST uses the same operating EBITDA definition for both periods.
Which VST product volumes grew in H1 FY27?
VST’s H1 FY27 unit growth came from power tillers and power weeders, while its three other disclosed product categories recorded declines. Power-tiller sales increased 9% to 27,158 units from 24,829 units in H1 FY26, while power-weeder volume rose 22% to 6,076 units from 4,970 units.
Domestic tractor volume declined 4% to 1,925 units from 2,010 units, and tractor export volume declined 11% to 501 units from 566 units. Power reapers recorded the largest percentage decline, falling 23% to 1,171 units from 1,512 units. The presentation supplies unit volumes rather than revenue by product, so it does not quantify each category’s contribution to H1 revenue of Rs 635 crore.
The absolute volume increase was 2,329 units for power tillers and 1,106 units for power weeders. Those gains were accompanied by falls of 85 domestic tractors, 65 export tractors and 341 power reapers, showing that the six-month sales pattern differed by product line.
Got a follow-up? Ask IRIS
What changed in VST’s Q2 FY27 sales volumes?
VST’s Q2 FY27 volumes increased only for power tillers, which rose 2% to 13,357 units from 13,128 units in Q2 FY26. Domestic tractor sales fell 12% to 940 units from 1,067 units, while tractor export volume declined 11% to 226 units from 254 units.
Power-weeder volume fell 9% to 2,396 units in Q2 FY27 from 2,621 units a year earlier. Power-reaper volume fell 20% to 1,143 units from 1,432 units. Despite these category declines, Q2 revenue rose by Rs 6.5 crore to Rs 321.6 crore, but VST does not disclose product pricing, product revenue or sales mix to explain that change.
Q2 also differed from the H1 trend for power weeders. The category increased by 1,106 units over H1 FY27 but declined by 225 units in the Q2 year-on-year comparison, while power-tiller growth slowed to 229 units in Q2 from a 2,329-unit H1 increase.
Why did VST’s H1 profit after tax rise despite lower operating EBITDA?
VST’s H1 FY27 profit after tax rose to Rs 71.5 crore from Rs 69.9 crore even though operating EBITDA declined to Rs 75.4 crore from Rs 78.4 crore. The result was a Rs 1.6 crore increase in profit after tax alongside a 1 percentage point decline in operating EBITDA margin to 12%.
The presentation does not reconcile the different movements in operating EBITDA and profit after tax. It states that operating EBITDA excludes other income and fair-value gain or loss, but it gives no figures for those items, finance costs, depreciation or tax in the H1 FY27 material. In Q2 FY27, both measures declined, with profit after tax at Rs 22.8 crore and operating EBITDA at Rs 35.1 crore.
Conclusion
VST’s H1 FY27 results show that 6% revenue growth to Rs 635 crore did not translate into higher operating EBITDA. Operating EBITDA fell to Rs 75.4 crore, the margin moved to 12% from 13%, and Q2 recorded a lower 11% margin. Product volumes were mixed, with H1 gains in power tillers and power weeders offset by declines in tractors and power reapers.
The next financial disclosure will be relevant for whether operating EBITDA changes from the Rs 35.1 crore reported in Q2 FY27 and whether the 11% quarterly margin changes. VST’s presentation does not disclose a margin target, cost plan or explanation for the decline, leaving the reconciliation between revenue growth, operating costs and profit after tax unresolved.