





Earnings Call/Transcript
VST Tillers Tractors Q2 FY27 Earnings Call Transcript
VST Tillers Tractors disclosed the transcript of its Q2 FY27 post-results conference call held on November 5, 2026.





IRIS
Multibagg AI is an AI powered stock research and analysis platform. We provide data, information, content, and analytics for publicly traded Indian companies listed on NSE and BSE. AI can make mistakes, check important information.
Prices might be delayed by a few minutes.
Join our Exclusive Community


Join our Exclusive Community
Made with 💙 in India. © Finsky Technologies Pvt Ltd. 2026


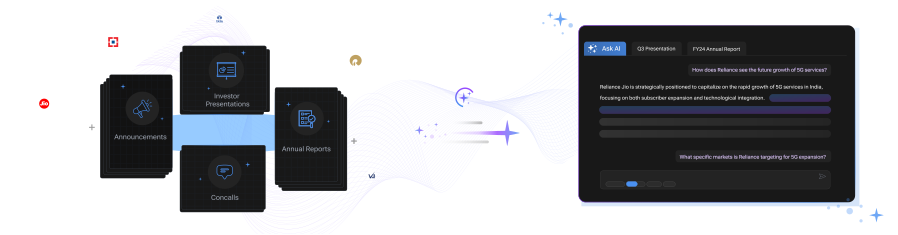
Get instant AI-powered insights about company performance, financials, and strategy. Ask questions about trends, competition, and developments while receiving responses backed by official documents and market data, with clear attribution to source documents.



 Discovery themes featuring this stock
Bearish
3
Neutral
7
Bullish
4
Bearish
25
Neutral
7
Bullish
14
Bearish
22
Neutral
0
Bullish
10
Bearish
22
Neutral
0
Bullish
10
Bearish
22
Neutral
0
Bullish
10
Bearish
22
Neutral
0
Bullish
10


VST Tillers Tractors Limited manufactures agricultural mechanisation equipment, including power tillers, power weeders, reapers, compact tractors, implements, engines and related components, serving small and marginal farmers in India and export markets. Its portfolio spans approximately 2 HP to 50 HP, with emphasis on practical, affordable equipment for diverse farming conditions.
VST delivered 6% first-half revenue growth to INR635 crore, while first-half PAT increased to INR71.5 crore from INR69.9 crore despite commodity inflation reducing operational EBITDA margin by approximately 100 basis points. The earnings profile therefore shows resilience at the profit level, although quarterly profitability weakened because of raw-material cost pressure.
The company expects small farm machinery to remain the principal growth engine. Power weeder volumes increased 22% during the first half, and management is targeting approximately 40% full-year growth, supported by new products, expanding distribution, improving retail finance and more than 800 dealerships with over 1,000 counters.
Domestic tractor growth is expected to remain broadly flat because drought has affected Maharashtra and Northern Karnataka, with Maharashtra representing approximately 40% of compact tractor business. Conversely, northern markets, Phantom products and the Zetor range are growing, but management indicated that this expansion may not fully offset weakness in affected regions.
VST is building a broader omnichannel and international growth platform. Its dealership and counter expansion aims to exceed 2,000 counters, while a Netherlands warehouse is expected to reduce European delivery times from 60–90 days to approximately two weeks from the fourth quarter, improving distributor inventory rotation and enabling smaller trial orders.
Agricultural, Commercial & Construction Vehicles
Tractors
3,436 Cr
Moderate Risk
32.3
25.6
1.4
3.0
6,371.15
3,800.00
Sales CAGR
Profit CAGR
ROE
ROCE

| Symbol | Watchlist | Price | Market Cap | P/E | P/B | Div Yield (%) | ROE (%) | ROCE (%) | ROA (%) |
3970.75 | 3,436 Cr | 32.30 | 3.00 | 0.63 | 9.29 | 11.94 | 7.21 | ||
200.20 | 1,653 Cr | -56.41 | 13.41 | 0.00 | -22.78 | 2.27 | -4.26 | ||
406.10 | 1,127 Cr | 23.59 | 2.30 | 0.74 | 9.14 | 11.58 | 5.97 | ||
1750.00 | 927 Cr | 193.86 | 31.21 | 0.00 | 16.09 | 11.81 | 6.59 | ||
385.05 | 920 Cr | 43.96 | 4.76 | 0.00 | 10.83 | 10.95 | 4.68 | ||
127.95 | 615 Cr | 24.67 | 1.10 | 0.00 | 4.44 | 7.37 | 3.23 | ||
540.50 | 568 Cr | 121.69 | 4.63 | 0.00 | 19.09 | 24.24 | 12.74 | ||
| Median: 7 Co. | — | 406.10 | 927 Cr | 32.30 | 4.63 | 0.00 | 9.29 | 11.58 | 5.97 |
View Standalone
View Standalone
View Standalone
View Standalone
View Standalone
View Standalone
View Standalone
View Standalone

 Discovery themes featuring this stock
Earnings Call/Transcript
VST Tillers Tractors disclosed the transcript of its Q2 FY27 post-results conference call held on November 5, 2026.
Financial Results
VST Tillers Tractors published newspaper extracts of unaudited standalone and consolidated financial results for the quarter and six months ended September 30, 2026.
VST Tillers Tractors Ltd (VSTTILLERS) is currently trading at 3,973.00 per share. Stock prices fluctuate during market hours on NSE and BSE based on demand, company updates, and overall market conditions. Refer to the live price chart above for the most recent price movement.
VST Tillers Tractors Limited manufactures agricultural mechanisation equipment, including power tillers, power weeders, reapers, compact tractors, implements, engines and related components, serving small and marginal farmers in India and export markets. Its portfolio spans approximately 2 HP to 50 HP, with emphasis on practical, affordable equipment for diverse farming conditions. VST delivered 6% first-half revenue growth to INR635 crore, while first-half PAT increased to INR71.5 crore from INR69.9 crore despite commodity inflation reducing operational EBITDA margin by approximately 100 basis points. The earnings profile therefore shows resilience at the profit level, although quarterly profitability weakened because of raw-material cost pressure. The company expects small farm machinery to remain the principal growth engine. Power weeder volumes increased 22% during the first half, and management is targeting approximately 40% full-year growth, supported by new products, expanding distribution, improving retail finance and more than 800 dealerships with over 1,000 counters. Domestic tractor growth is expected to remain broadly flat because drought has affected Maharashtra and Northern Karnataka, with Maharashtra representing approximately 40% of compact tractor business. Conversely, northern markets, Phantom products and the Zetor range are growing, but management indicated that this expansion may not fully offset weakness in affected regions. VST is building a broader omnichannel and international growth platform. Its dealership and counter expansion aims to exceed 2,000 counters, while a Netherlands warehouse is expected to reduce European delivery times from 60–90 days to approximately two weeks from the fourth quarter, improving distributor inventory rotation and enabling smaller trial orders.
Over the past 52 weeks, VST Tillers Tractors Ltd has traded between a low of ₹3,800.00 and a high of ₹6,371.15. The 52-week high and low indicate the stock’s price range over the last year and help investors understand its volatility and recent trading levels.
VST Tillers Tractors Ltd has a market capitalization of approximately 3,435.79. Market capitalization represents the total value of a company’s outstanding shares and helps investors understand its size, stability, and relative risk compared to other listed companies.
VST Tillers Tractors Ltd’s investment profile depends on its business fundamentals, valuation, and long-term outlook. The stock currently trades at a PE ratio of 32.30 and operates in the its sector sector. Investors typically assess financial performance, growth prospects, and individual risk tolerance before making investment decisions.
Based on its market capitalization of 3,435.79 Cr, VST Tillers Tractors Ltd is classified as a Small Cap stock. Large-cap stocks are generally more stable, while mid-cap and small-cap stocks tend to offer higher growth potential along with higher price volatility.
VST Tillers Tractors Ltd operates in the its sector sector. Sector classification matters because companies in the same sector are often affected by similar economic conditions, regulatory changes, and competitive dynamics, which can influence overall stock performance.
The Price-to-Earnings (PE) ratio of VST Tillers Tractors Ltd is 32.30. The PE ratio compares a company’s share price to its earnings and is commonly used to assess valuation. Comparing the PE ratio with sector peers and historical levels provides better context.
VST cited severe drought in Maharashtra and northern Karnataka, along with a competitor’s lower pricing in Gujarat over the preceding two to three months. Maharashtra accounts for almost 40% of VST’s compact-tractor business, so growth in northern India has not fully offset the state’s decline.
VST’s fastest-growing reported product was the power weeder, with volume up 22% year on year to 6,076 units in H1 FY27. That was an increase of 1,106 units from 4,970 units in H1 FY26. Power tillers grew 9%, which was a lower percentage rate but a larger increase in absolute units.
VST reported an operating EBITDA margin of 12% in H1 FY27. This was lower than the 13% margin reported in H1 FY26. VST defines operating EBITDA as excluding other income and fair-value gain or loss.
V.S.T. Tillers Tractors reported Rs 24.30 crore of net cash from operating activities for the half year ended September 30, 2026. That was down from Rs 62.49 crore in the corresponding half year ended September 30, 2025, a reduction of Rs 38.19 crore.
