










VST H1 tiller and weeder volumes rise as tractor sales decline
Key highlights
- VST power weeder volume rose 22% to 6,076 units in H1 FY27.
- VST power tiller volume increased 9% to 27,158 units in H1 FY27.
- VST domestic tractor and export tractor volumes fell 4% and 11%, respectively, in H1 FY27.
- VST H1 FY27 revenue rose 6% to Rs 635 crore while Op. EBITDA margin was 12%, versus 13.0% a year earlier.
powered by IRIS
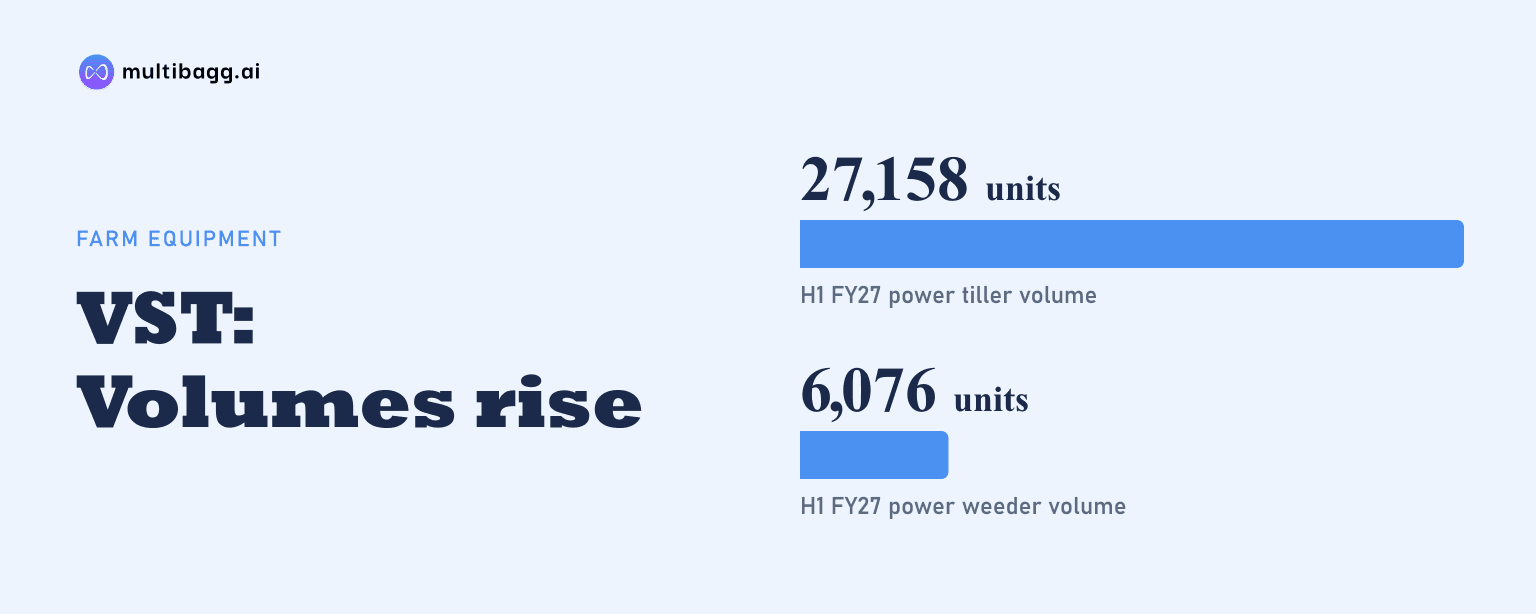
V.S.T. Tillers Tractors Limited reported divergent H1 FY27 product volumes, with power weeder sales rising 22% to 6,076 units and power tiller sales rising 9% to 27,158 units, while domestic tractor, export tractor and power reaper volumes declined. The five disclosed categories together increased by 2,944 units from H1 FY26.
Know VST Tillers Tractors inside out
Results, valuation, peers and who's buying, in one view.
How did VST’s H1 FY27 sales volumes change?
VST’s H1 FY27 volume growth was led by power weeders and power tillers, while all three other reported categories declined from H1 FY26. Power weeder volume increased by 1,106 units to 6,076, the largest reported percentage gain at 22%. Power tiller volume, VST’s largest reported category, increased by 2,329 units to 27,158. Domestic tractors declined by 85 units to 1,925, tractor exports fell by 65 units to 501, and power reapers decreased by 341 units to 1,171.
Across the five disclosed categories, VST sold 36,831 units in H1 FY27, compared with 33,887 units in H1 FY26, based on the presentation’s product figures. The 2,944-unit increase came despite a combined 491-unit reduction in domestic tractors, exported tractors and power reapers. Power tillers accounted for 27,158 units, or nearly three quarters of the reported H1 FY27 total, so their 9% expansion remained central to the period’s unit growth.
Why did VST’s quarterly mix differ from its first-half mix?
VST’s Q2 FY27 mix differed from its H1 outcome because power weeders declined in the quarter even though they grew over the six-month period. Q2 FY27 power weeder volume fell 9% year on year to 2,396 units from 2,621 units. Power tillers still increased, but by 2% to 13,357 units, compared with the 9% H1 FY27 increase to 27,158 units. The presentation does not state reasons for the different quarterly and first-half growth rates.
The five categories totalled 18,062 units in Q2 FY27, down from 18,502 units in Q2 FY26, using the reported unit figures. Domestic tractor volume fell by 127 units in the quarter, larger than the 85-unit domestic-tractor decline recorded for H1 FY27. Power reaper volume fell by 289 units in Q2 FY27, close to the full first-half reduction of 341 units, indicating that most of the H1 reaper shortfall was recorded in the second quarter.
Got a follow-up? Ask IRIS
Which product categories drove VST’s volume change?
VST’s 2,944-unit H1 FY27 increase was driven entirely by the 2,329 additional power tillers and 1,106 additional power weeders sold. Together, those two categories added 3,435 units from H1 FY26. That expansion more than offset declines of 85 domestic tractors, 65 export tractors and 341 power reapers. The presentation reports units rather than revenue by product, so it does not quantify the sales-value or profit contribution of each category.
Power tillers represented 27,158 of VST’s 36,831 disclosed H1 FY27 units, compared with 24,829 of 33,887 units in H1 FY26. Power weeders increased their share of the reported unit total as their volume reached 6,076, while reapers fell to 1,171 units from 1,512. The tractor business recorded 2,426 units when domestic and export volumes are combined in H1 FY27, down from 2,576 in H1 FY26, a reduction of 150 units.
How did the volume mix coincide with VST’s H1 financial performance?
VST reported H1 FY27 revenue of Rs 635 crore, up 6% from Rs 597.6 crore in H1 FY26, alongside the increase in reported unit volumes from 33,887 to 36,831. Operating earnings before interest, tax, depreciation and amortisation, or Op. EBITDA, were Rs 75.4 crore, down from Rs 78.4 crore. The Op. EBITDA margin was 12% of revenue, compared with 13.0% a year earlier; VST defines this measure as excluding other income and fair-value gain or loss.
Profit after tax, or PAT, was Rs 71.5 crore in H1 FY27, compared with Rs 69.9 crore in H1 FY26. In Q2 FY27, revenue rose 2% to Rs 321.6 crore from Rs 315.1 crore, while Op. EBITDA decreased to Rs 35.1 crore from Rs 40.9 crore and PAT fell to Rs 22.8 crore from Rs 25.4 crore. The presentation supplies no product-level pricing, revenue or margin data, so it does not establish whether the shift toward tillers and weeders caused the financial changes.
Conclusion
VST’s H1 FY27 data show growth concentrated in two mechanisation categories: power tillers added 2,329 units and power weeders added 1,106 units. Those gains outweighed a 150-unit combined decline in domestic and export tractors and a 341-unit reduction in power reapers. Revenue increased 6% to Rs 635 crore, but Op. EBITDA decreased by Rs 3 crore and margin moved to 12% from 13.0%.
The key unresolved matters are why power weeder volume fell 9% to 2,396 units in Q2 FY27 despite its 22% H1 growth, and why tractor exports and reapers declined 11% and 23%, respectively, in H1 FY27. VST’s November 5, 2026 presentation provides no volume targets, product-specific financial targets or explanations for those movements.