










Wanbury Limited Q2 Revenue Rises 14.3% to ₹182.91 Crore
Key highlights
- Wanbury Limited reported Q2 FY27 standalone revenue of ₹182.91 crore, up 14.3% year-on-year.
- Q2 FY27 EBITDA was ₹25.91 crore, compared with ₹25.78 crore in the year-ago quarter.
- Wanbury's EBITDA margin declined to 14.3% in Q2 FY27 from 16.2% in Q2 FY26.
- Standalone profit after tax was ₹11.88 crore in Q2 FY27, versus ₹3.24 crore in Q1 FY27.
powered by IRIS
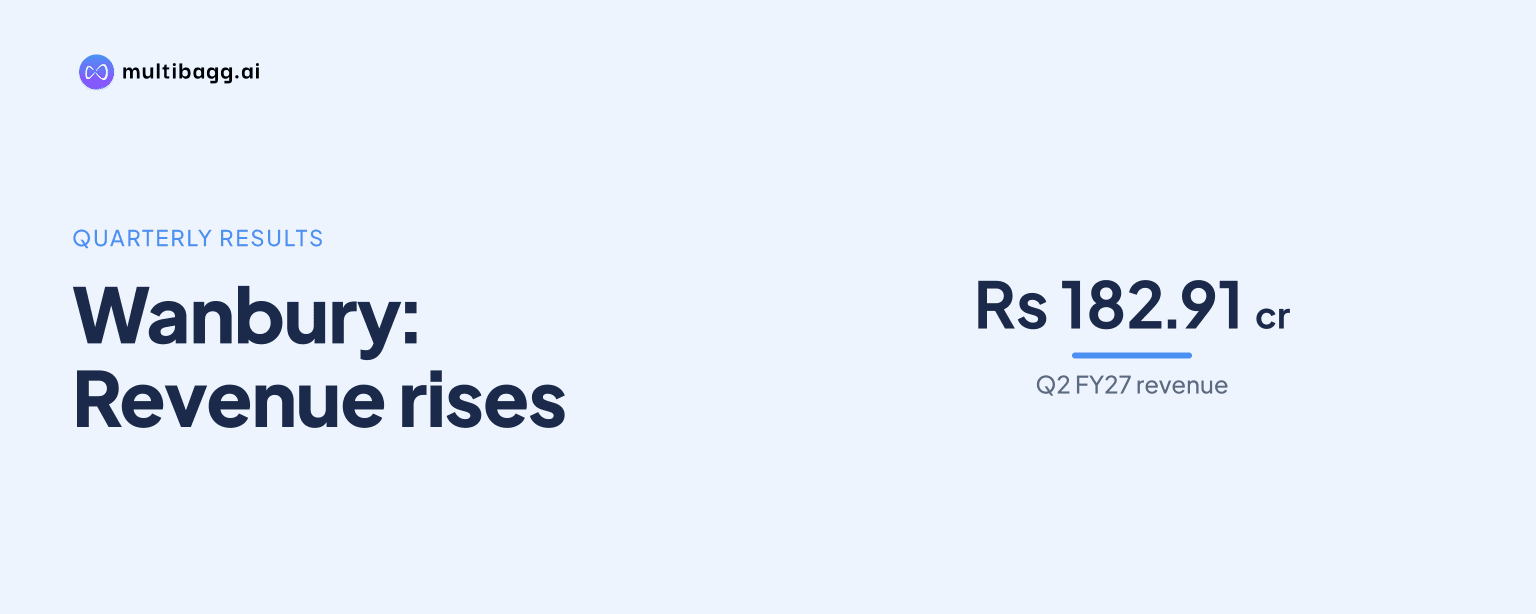
Wanbury Limited reported standalone revenue from operations of ₹182.91 crore for Q2 FY27, a 14.3% year-on-year increase, while EBITDA margin declined to 14.3% from 16.2% a year earlier. The September-quarter result shows higher sales but pressure on operating profitability.
Know Wanbury inside out
Results, valuation, peers and who's buying, in one view.
What did Wanbury report for Q2 FY27?
Wanbury reported revenue from operations of ₹182.91 crore for the quarter ended 30 September 2026. The company filed its unaudited standalone results on 4 November 2026 after its board approved the September-quarter and first-half financial statements.
Standalone profit after tax stood at ₹11.88 crore, compared with ₹3.24 crore in the preceding quarter, according to the results filing. EBITDA was ₹25.91 crore, marginally higher than ₹25.78 crore in the year-ago period. The figures indicate that revenue growth did not result in a similar improvement in operating margin.
Why did Wanbury's operating margin decline?
Wanbury's EBITDA margin declined by 190 basis points year-on-year to 14.3%, despite the increase in revenue. The filing-based data therefore points to a lower proportion of sales being retained as operating profit during the quarter.
Other reported financial data indicates that employee costs increased to ₹34.47 crore from ₹28.69 crore in the prior quarter. Interest expense was ₹6.30 crore, lower than ₹7.54 crore in Q1 FY27 but still a material charge against profit. These costs were relevant to the gap between higher revenue and the company's profitability measures.
A separate summary of the quarterly data put operating profit before depreciation, interest and tax at ₹22.73 crore and reported an operating margin of 12.43%. The results coverage also cites ₹25.91 crore as quarterly EBITDA and a 14.3% margin. Investors should distinguish between reported standalone measures and calculations that may use different definitions of operating profit.
How did the September-quarter revenue growth develop?
Wanbury's Q2 revenue was higher than both the year-ago quarter and the immediately preceding quarter. Reported revenue of ₹182.91 crore was up from ₹161.19 crore in September 2025 and from ₹163.18 crore in Q1 FY27, based on the figures cited in the quarterly results coverage.
For the first half of FY27, standalone revenue reached ₹348.49 crore, compared with ₹323.24 crore in the first half of FY26. That increase provides the broader context for the September-quarter result: the company maintained higher sales through the first six months of the financial year.
The company has not published an earnings-call transcript for the quarter. As a result, the available information is limited to the financial results statement and filing-based summaries, rather than management commentary on product demand, costs or outlook.
Got a follow-up? Ask IRIS
What is the difference between Wanbury's standalone and consolidated figures?
Wanbury's board approved standalone financial results for Q2 and H1 FY27. The filing-based standalone result reported revenue of ₹182.91 crore and profit after tax of ₹11.88 crore for the quarter.
The company also reports consolidated revenue that includes operations of Wanbury Skin Health Limited, a subsidiary incorporated during the quarter. Some results summaries cited consolidated profit after tax of ₹8.53 crore and a 4.66% PAT margin. These figures should not be directly compared with standalone profit without recognising the difference in reporting scope.
Wanbury Skin Health Limited has also announced the launch of its berrysolftTM baby product range across multiple Indian states, marking its entry into paediatric dermatology. The quarterly information does not quantify the subsidiary's revenue or earnings contribution.
What does the result mean for Wanbury investors?
For investors, the central takeaway is that Wanbury delivered double-digit revenue growth but saw lower EBITDA margin than in the corresponding quarter last year. Revenue rose 14.3% year-on-year, while the reported EBITDA margin fell to 14.3% from 16.2%.
The standalone profit after tax of ₹11.88 crore was significantly above the ₹3.24 crore reported in Q1 FY27. However, quarterly comparisons should account for changes in tax expense, finance costs and other non-operating items. The company had not issued management guidance through an earnings-call transcript at the time of the results.
Wanbury's promoter holding was 42.98% as of September 2026. Expert Chemicals (India) Pvt Ltd held 34.33%, while Kingsbury Investments Inc held 8.65%. The company was reported to have a market capitalisation of about ₹673 crore around the results date.
Conclusion
Wanbury's Q2 FY27 standalone results show revenue of ₹182.91 crore and year-on-year growth of 14.3%, supported by a higher first-half revenue base. But EBITDA margin fell by 190 basis points to 14.3%, making cost control and the quality of profit conversion important considerations alongside sales growth.
The next disclosed financial checkpoint will be the company's subsequent quarterly results and any accompanying management communication. Investors will watch whether revenue growth continues, whether employee and finance costs remain elevated, and whether Wanbury Skin Health Limited begins to have a measurable effect on consolidated performance.