










Wanbury EBITDA reached Rs 107.69 crore as FY26 margin hit 17%
Key highlights
- Wanbury reported FY26 EBITDA of Rs 107.69 crore, compared with Rs 24.09 crore in FY23.
- Wanbury’s FY26 revenue from operations was Rs 650.26 crore and EBITDA margin was 17%.
- Working-capital days rose to 59.4 in FY26 from negative 79.27 days in FY23.
- Trade receivables reached Rs 143.27 crore in FY26, while operating cash flow was Rs 31.53 crore.
powered by IRIS
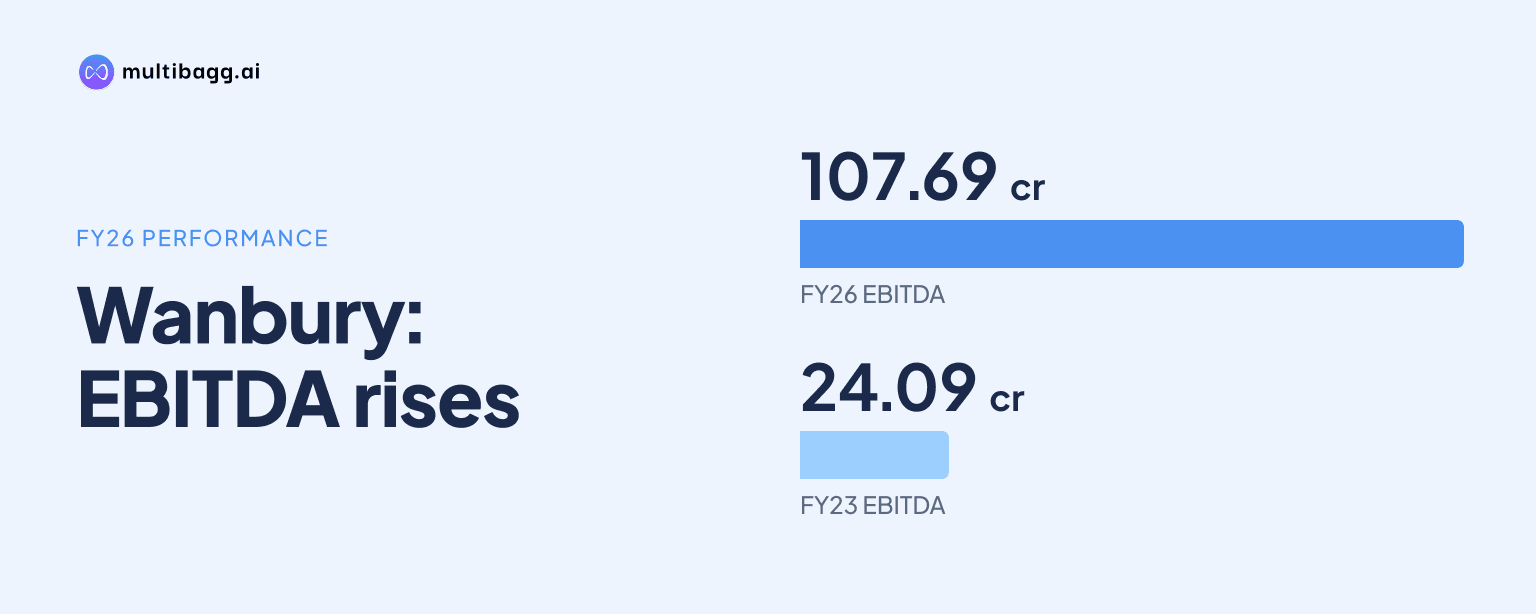
Wanbury Limited reported EBITDA of Rs 107.69 crore in FY26, up from Rs 24.09 crore in FY23, as EBITDA margin increased from 5% to 17%. The earnings improvement occurred alongside working-capital days rising from negative 79.27 days to 59.4 days, with receivables and inventories increasing while trade payables declined.
Know Wanbury inside out
Results, valuation, peers and who's buying, in one view.
How did Wanbury’s operating performance change from FY23 to FY26?
Wanbury increased revenue from operations by Rs 150.61 crore between FY23 and FY26, while EBITDA increased by Rs 83.60 crore. Revenue rose from Rs 499.65 crore in FY23 to Rs 650.26 crore in FY26. Gross profit increased from Rs 197.12 crore to Rs 374.70 crore, and gross margin rose from 39% to 58% over the same period.
The improvement developed over three years rather than occurring only in FY26. Revenue was Rs 575.65 crore in FY24 and Rs 599.51 crore in FY25 before reaching Rs 650.26 crore in FY26. EBITDA rose to Rs 72.99 crore in FY24, reached Rs 79.81 crore in FY25 in the five-year profit-and-loss snapshot, and then advanced to Rs 107.69 crore in FY26.
Cost of goods sold, or COGS, fell from Rs 303.40 crore in FY23 to Rs 276.51 crore in FY26, even as revenue increased. Operating expenses moved in the other direction, rising from Rs 173 crore in FY23 to Rs 267 crore in FY26. The reported gross-margin expansion of 19 percentage points was accompanied by a 12-percentage-point increase in EBITDA margin.
Did Wanbury’s EBITDA improvement translate into FY26 profit?
Yes, Wanbury moved from a loss after tax of Rs 10.40 crore in FY23 to profit after tax, or PAT, of Rs 66.13 crore in FY26. PAT was Rs 30.40 crore in FY24 and Rs 30.53 crore in FY25. PAT margin changed from negative 2% in FY23 to 10% in FY26, while basic earnings per share moved from a loss of Rs 3.18 to earnings of Rs 20.55.
Finance cost increased from Rs 21.40 crore in FY23 to Rs 36.95 crore in FY25 before declining to Rs 29.98 crore in FY26. Depreciation rose from Rs 12.38 crore in FY23 to Rs 14.31 crore in FY26. As a result, profit before tax moved from a loss of Rs 9.69 crore in FY23 to a profit of Rs 59.80 crore in FY26.
The FY26 profit-and-loss statement also records an exceptional item of Rs 3.60 crore. The presentation reports no exceptional item in FY24 or FY25, while it records a negative exceptional item of Rs 0.60 crore in FY23. Reported FY26 PAT therefore includes this disclosed exceptional item as well as operating and financing movements.
Why did Wanbury’s working-capital days rise to 59.4 days?
Wanbury’s working-capital days increased to 59.4 days in FY26 from negative 79.27 days in FY23 as receivables and inventory rose while trade payables reduced. The metric had moved to negative 17.47 days in FY24 and then to 19.34 days in FY25. The FY23-to-FY26 change was 138.67 days.
Trade receivables increased from Rs 68.98 crore in FY23 to Rs 143.27 crore in FY26, while inventories rose from Rs 21.99 crore to Rs 50.63 crore. Trade payables moved lower, from Rs 148.20 crore in FY23 to Rs 107.25 crore in FY26. These three balance-sheet lines changed the funding mix reflected in the working-capital-days measure.
Total assets rose from Rs 302.20 crore in FY23 to Rs 517.67 crore in FY26. Tangible assets increased from Rs 151.50 crore to Rs 210.26 crore, while capital work in progress, or CWIP, rose from Rs 1.61 crore to Rs 25.42 crore. The balance-sheet snapshot separately reports cash and bank balances of Rs 3.89 crore at FY23 end and Rs 7.63 crore at FY26 end.
Got a follow-up? Ask IRIS
What does Wanbury’s cash-flow record show during the turnaround?
Wanbury reported positive cash flow from operating activities in every year from FY23 through FY26, although the amounts were below reported EBITDA. Operating cash flow was Rs 19.80 crore in FY23, Rs 4.02 crore in FY24, Rs 26.10 crore in FY25 and Rs 31.53 crore in FY26. FY26 operating cash flow was Rs 76.16 crore lower than FY26 EBITDA of Rs 107.69 crore.
Cash flow used in investing activities increased from Rs 8.84 crore in FY23 to Rs 56.40 crore in FY26. That increase coincided with the rise in tangible assets to Rs 210.26 crore and CWIP to Rs 25.42 crore in FY26. The cash-flow statement records net cash outflow of Rs 2.45 crore in FY26, after an inflow of Rs 0.66 crore in FY25.
Financing activities generated Rs 22.42 crore in FY26, compared with an outflow of Rs 31.99 crore in FY23. Long-term borrowings declined to Rs 147.15 crore in FY26 from Rs 160.29 crore in FY25, but short-term borrowings increased to Rs 68.30 crore from Rs 12.94 crore. The cash-flow statement reports cash at year-end of Rs 1.61 crore in FY26, compared with Rs 4.06 crore at the start of that year.
How did Wanbury’s returns and capital base change?
Wanbury reported return on capital employed, or ROCE, of 28% in FY26, compared with 130% in FY23. Return on equity, or ROE, was 46% in FY26, down from 143% in FY23. These ratios changed while EBITDA rose to Rs 107.69 crore and total equity and liabilities expanded to Rs 517.67 crore.
Other equity moved from negative Rs 39.96 crore in FY23 to Rs 109.51 crore in FY26. Equity share capital increased from Rs 32.70 crore to Rs 34.94 crore during the same period. Total assets matched total equity and liabilities at Rs 517.67 crore in FY26, compared with Rs 302.20 crore in FY23.
Conclusion
Wanbury’s FY26 financial profile shows a substantial improvement in reported operating and net earnings from FY23, led by revenue growth, lower COGS and higher margins. EBITDA rose by Rs 83.60 crore and PAT moved from a Rs 10.40 crore loss to Rs 66.13 crore profit, but receivables, inventory and investment cash outflows also increased as working-capital days turned positive.
Management expects better H2FY27 topline and profitability through complete margin recovery in the existing portfolio and commercialisation of newer products. Management also expects progress on new active pharmaceutical ingredient, or API, launches toward the end of the current financial year; the next disclosures can show whether receivables of Rs 143.27 crore, working-capital days of 59.4 and operating cash flow of Rs 31.53 crore move alongside that plan.