










Wanbury Q2 recovery leaves first-half profit 47% lower year on year
Key highlights
- Wanbury’s Q2FY27 revenue from operations rose 14% year on year to Rs 182.91 crore.
- Wanbury’s H1FY27 PAT fell 47% year on year to Rs 15.13 crore.
- Wanbury’s H1FY27 gross margin declined 273 basis points to 53.39%.
- Wanbury’s H1FY27 API revenue rose 9% to Rs 310 crore, while formulations revenue was Rs 39 crore.
powered by IRIS
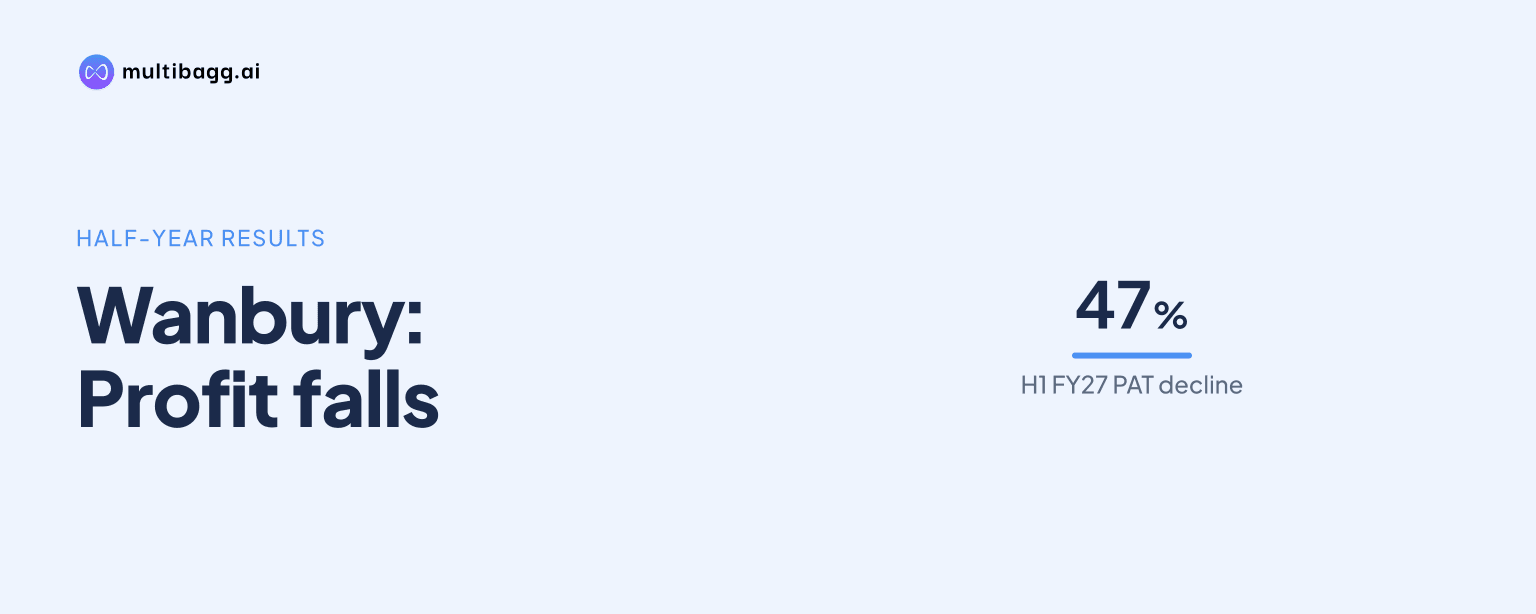
Wanbury Limited reported that second-quarter (Q2) FY27 revenue from operations rose 14% year on year to Rs 182.91 crore, yet first-half (H1) profit after tax (PAT) fell 47% to Rs 15.13 crore as cost of goods sold rose 14%, faster than revenue. Management said elevated crude-linked raw-material prices continued to affect year-on-year margins.
Know Wanbury inside out
Results, valuation, peers and who's buying, in one view.
Why did Wanbury’s first-half profit decline despite revenue growth?
Wanbury’s H1FY27 PAT declined because input costs and operating expenses increased faster than revenue. Revenue from operations rose 8% to Rs 348.49 crore from Rs 323.24 crore in H1FY26, while cost of goods sold (COGS) increased 14% to Rs 162.93 crore from Rs 142.40 crore. Gross profit consequently rose only 3% to Rs 186.05 crore, and gross margin declined by 273 basis points to 53.39%.
The margin reduction flowed through to earnings before interest, tax, depreciation and amortisation (EBITDA), which fell 16% to Rs 42.81 crore from Rs 50.77 crore. EBITDA margin fell 342 basis points to 12.28%, while operating expenses rose 10% to Rs 143.24 crore. Finance cost declined 3% to Rs 14.27 crore, but depreciation increased 12% to Rs 8.23 crore and profit before tax declined 29% to Rs 20.30 crore.
Wanbury’s PAT margin more than halved to 4.34% in H1FY27 from 8.87% in H1FY26, a decline of 453 basis points. Basic earnings per share also fell 50% to Rs 4.33 from Rs 8.70. These figures show that the 8% increase in H1 revenue did not offset the higher cost base during the period.
How much did Wanbury recover in Q2 FY27?
Wanbury recovered sequentially in Q2FY27 after the preceding quarter, with revenue from operations increasing 10% to Rs 182.91 crore from Rs 165.58 crore in Q1FY27. EBITDA increased 58% to Rs 26.21 crore from Rs 16.60 crore, while PAT rose 266% to Rs 11.88 crore from Rs 3.24 crore. Management described Q2 as a recovery from disruption caused by the West Asia crisis in Q1FY27.
Margins also improved from Q1FY27 but remained below the prior-year quarter. Gross margin rose to 54.18% from 52.51% in Q1FY27, an increase of 167 basis points, while EBITDA margin rose to 14.33% from 10.02%. However, Q2FY27 gross margin was 405 basis points below 58.23% in Q2FY26, and EBITDA margin was 190 basis points below 16.23% a year earlier.
Year-on-year cost pressure remained visible in the Q2 figures. COGS increased 25% to Rs 83.93 crore from Rs 67.06 crore, compared with a 14% increase in revenue from operations. Gross profit rose 6% to Rs 99.10 crore, while PAT declined 22% from Rs 15.18 crore. PAT margin was 6.50%, compared with 9.48% in Q2FY26.
Management said prices of solvents and other crude-oil-linked raw materials remained elevated through Q2FY27. It said it passed a substantial part of the increase to customers during the quarter and expects to pass on the balance in the coming quarter. Finance cost declined 21% sequentially to Rs 6.30 crore after refinancing borrowings at a lower interest rate, according to management.
Got a follow-up? Ask IRIS
Which Wanbury businesses generated revenue growth?
Wanbury’s active pharmaceutical ingredients (API) business accounted for most of the revenue growth. API revenue increased 16% year on year to Rs 161 crore in Q2FY27 from Rs 138 crore, and was also above Rs 149 crore in Q1FY27. For H1FY27, API revenue rose 9% to Rs 310 crore from Rs 283 crore in H1FY26.
Wanbury’s formulations business recorded a smaller Q2 increase and lower displayed H1 revenue. Formulations revenue was Rs 22 crore in Q2FY27, compared with Rs 21 crore in Q2FY26 and Rs 17 crore in Q1FY27. The H1FY27 figure was Rs 39 crore, compared with Rs 41 crore in H1FY26, while the presentation’s segment figures are rounded.
The formulations strategy includes a transition from acute therapies towards speciality and chronic segments. Wanbury listed paediatrics, dermatology, cardiology and diabetes as upcoming therapeutic areas, and said it plans expansion into newer regions and a larger field force in existing regions. It also identified scaling top brands and increasing front-line doctor engagement as components of its profitability plan from FY27 onwards.
What does Wanbury expect in the second half of FY27?
Wanbury expects improved revenue and profitability in the second half of FY27, according to management, based on complete recovery of margins in the existing portfolio and commercialisation of newer products. The stated margin-recovery mechanism is completion of customer price pass-throughs for elevated solvent and crude-linked input costs. The reported gross margin was 54.18% in Q2FY27, compared with 53.39% for H1FY27.
Management said progress on new API launches is expected towards the end of the current financial year, with a contribution to performance expected in the following year. It also said it was strengthening the pipeline of products under evaluation for commercialisation. The timing and financial contribution of those launches were not quantified in the presentation.
Wanbury disclosed several operational developments during Q2FY27. It received nine US Food and Drug Administration letters for Metformin HCl, along with similar letters for Paroxetine HCl and Diphenhydramine HCl; a Certificate of Suitability for Rivaroxaban API from the European Directorate for the Quality of Medicines; and a Therapeutic Goods Administration good manufacturing practice compliance certificate for its Tanuku site.
The company added Metformin business in Saudi Arabia and Mexico and launched the berrysoft baby range through Wanbury Skin Health Limited, marking entry into paediatric dermatology. Separately, Wanbury’s formulations strategy page sets out an objective of profitability break-even in FY26 through scale and cost management, followed by sustainable profitability from FY27 through brand scaling, new therapies and doctor engagement.
Conclusion
Wanbury’s Q2FY27 recovery improved revenue, EBITDA and PAT from Q1FY27, but did not reverse the first-half effect of higher input costs. H1 revenue rose 8% to Rs 348.49 crore, while COGS increased 14%, compressing gross margin to 53.39% and reducing PAT by 47% to Rs 15.13 crore. API revenue rose to Rs 310 crore in H1FY27, whereas formulations revenue was Rs 39 crore.
The next results should indicate whether Wanbury completes the remaining customer price pass-through and sustains the lower finance cost following refinancing. Management’s disclosed milestones are progress on new API launches near the end of FY27 and commercialisation in the following year, alongside its expectation of improved second-half revenue and profitability.