










Western Carriers H1 profit fell 9.6% as margins narrowed
Key highlights
- Western Carriers’ H1-FY27 operational revenue rose 6.8% to Rs 913.5 crore.
- WC’s H1-FY27 PAT fell 9.6% to Rs 17.8 crore.
- WC’s H1-FY27 EBITDA margin declined 19 basis points year on year to 4.44%.
- WC’s Q2-FY27 EBITDA margin was 4.88%, versus 4.02% in Q1-FY27.
powered by IRIS
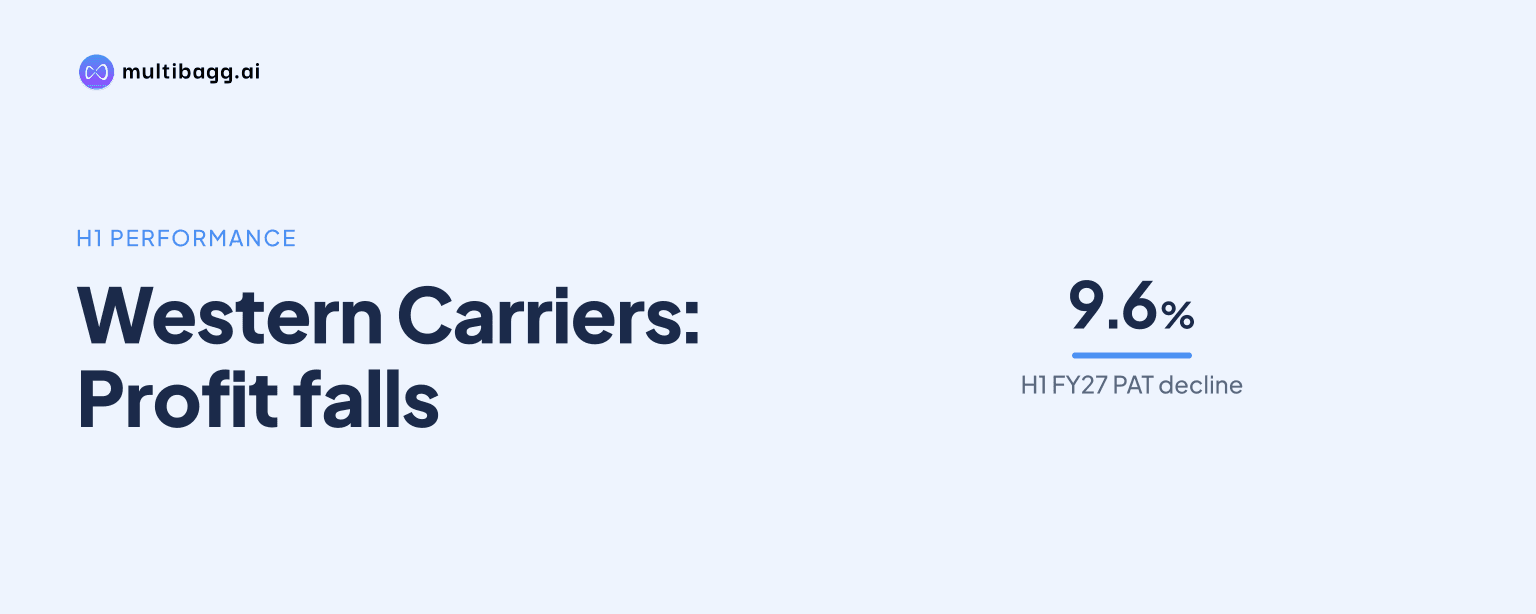
Western Carriers reported H1-FY27 profit after tax of Rs 17.8 crore, down 9.6% year on year, despite operational revenue rising 6.8% to Rs 913.5 crore. Earnings before interest, tax, depreciation and amortisation margin fell 19 basis points to 4.44%, as total expenses increased 7.0% and other income declined 27.1%.
Know Western Carriers (India) inside out
Results, valuation, peers and who's buying, in one view.
Why did WC’s H1-FY27 profit decline?
WC’s H1-FY27 profit declined as total expenses grew faster than operational revenue and other income fell. Operational revenue increased by Rs 58.1 crore to Rs 913.5 crore from Rs 855.4 crore in H1-FY26, while total expenses increased by Rs 57.1 crore to Rs 872.9 crore. Earnings before interest, tax, depreciation and amortisation, or EBITDA, therefore rose only 2.5% to Rs 40.6 crore.
Other income fell by Rs 2.3 crore to Rs 6.2 crore in H1-FY27, while depreciation increased by Rs 1.9 crore to Rs 14.1 crore. Finance cost declined 4.4% to Rs 8.7 crore and tax expense fell 12.5% to Rs 6.3 crore. WC’s share in profit of joint venture was Rs 10 lakh in both H1-FY26 and H1-FY27.
How much did WC’s H1 margins narrow?
WC’s EBITDA margin fell to 4.44% in H1-FY27 from 4.63% in H1-FY26, while profit after tax, or PAT, margin declined to 1.95% from 2.30%. The EBITDA margin reduction was 19 basis points and the PAT margin reduction was 35 basis points. A basis point is one-hundredth of a percentage point.
Expenses were Rs 872.9 crore against Rs 913.5 crore of revenue in H1-FY27, compared with Rs 815.8 crore against Rs 855.4 crore a year earlier. EBITDA increased by Rs 1.0 crore, materially less than the Rs 58.1 crore increase in revenue. Below EBITDA, profit before tax fell by Rs 2.8 crore to Rs 24.1 crore, and PAT declined by Rs 1.9 crore to Rs 17.8 crore.
Did WC’s second quarter show a different trend?
WC’s Q2-FY27 EBITDA and PAT improved from Q1-FY27 and Q2-FY26, although quarterly revenue was below the preceding quarter. Q2-FY27 operational revenue was Rs 448.6 crore, up 2.0% from Rs 439.6 crore in Q2-FY26, while EBITDA rose 16.5% to Rs 21.9 crore. EBITDA margin reached 4.88%, compared with 4.28% a year earlier.
Against Q1-FY27, Q2 revenue declined 3.5% from Rs 464.9 crore, but total expenses declined 4.4% to Rs 426.7 crore. EBITDA increased 17.1% from Rs 18.7 crore and EBITDA margin increased by 86 basis points from 4.02%. PAT rose 4.6% sequentially to Rs 9.1 crore, while finance cost increased 35.1% from Rs 3.7 crore to Rs 5.0 crore.
Got a follow-up? Ask IRIS
How does H1-FY27 compare with WC’s longer profitability trend?
WC’s H1-FY27 margins were below the levels reported in FY24, FY25 and FY26, continuing the sequence shown in the presentation. EBITDA margin moved from 8.67% in FY24 to 6.95% in FY25, 4.65% in FY26 and 4.44% in H1-FY27. PAT margin moved from 4.76% to 3.77%, 2.12% and 1.95% over the same periods.
Revenue increased from Rs 1,685.8 crore in FY24 to Rs 1,725.7 crore in FY25 and Rs 1,829.2 crore in FY26. EBITDA declined from Rs 146.1 crore in FY24 to Rs 119.9 crore in FY25 and Rs 85.0 crore in FY26. PAT also declined from Rs 80.3 crore to Rs 65.1 crore and then Rs 38.8 crore, before H1-FY27 PAT of Rs 17.8 crore.
Return on equity, or ROE, declined from 20.93% in FY24 to 11.55% in FY25 and 5.44% in FY26. Return on capital employed, or ROCE, declined from 22.41% to 10.62% and then 4.58%; the presentation says both measures are adjusted for unutilised initial public offering proceeds. Working-capital days increased from 56 in FY24 to 99 in FY25 and 115 in FY26.
What do WC’s cash flow and balance-sheet figures show?
WC reported net cash from operating activities of Rs 17.6 crore in H1-FY27, compared with net operating cash outflows of Rs 21.8 crore in FY26 and Rs 2.7 crore in FY25. Cash generated from operations was Rs 24.6 crore in H1-FY27 after a working-capital outflow of Rs 17.5 crore. Direct taxes paid were Rs 7.0 crore.
Cash and cash equivalents declined to Rs 2.9 crore at H1-FY27 from Rs 9.2 crore at FY26. Investing activities used Rs 56.5 crore in H1-FY27, while financing activities provided Rs 32.6 crore. Current borrowings rose to Rs 240.9 crore from Rs 210.8 crore and non-current borrowings rose to Rs 18.7 crore from Rs 6.4 crore; the reported debt-to-equity ratio remained 0.3 times.
Conclusion
WC’s H1-FY27 results show that revenue growth did not translate into higher reported profit. Operational revenue rose 6.8% to Rs 913.5 crore, but total expenses increased 7.0%, EBITDA margin declined to 4.44%, and PAT fell 9.6% to Rs 17.8 crore. Q2-FY27 improved on Q1-FY27, with EBITDA margin reaching 4.88%, but the half-year and multi-year figures show lower margins than earlier reported periods.
The next results will show whether Q2-FY27 expense movement can be sustained, after total expenses fell 4.4% quarter on quarter while revenue declined 3.5%. The presentation does not disclose a margin target, earnings target or scheduled operating plan, leaving the relationship between revenue growth, expenses and the H1-FY27 EBITDA margin of 4.44% unresolved.