










Western Overseas cash rose on Rs 7.15 crore financing inflow
Key highlights
- Western Overseas reported FY26 PAT of Rs 2.73 crore but negative operating cash flow of Rs 1.70 crore.
- FY26 financing inflow of Rs 7.15 crore produced a Rs 4.78 crore increase in cash and cash equivalents.
- Total equity rose from Rs 6.53 crore in FY25 to Rs 18.53 crore in FY26.
- Western Overseas ended FY26 with Rs 4.99 crore of cash and bank balance against Rs 2.10 crore of short-term borrowings.
powered by IRIS
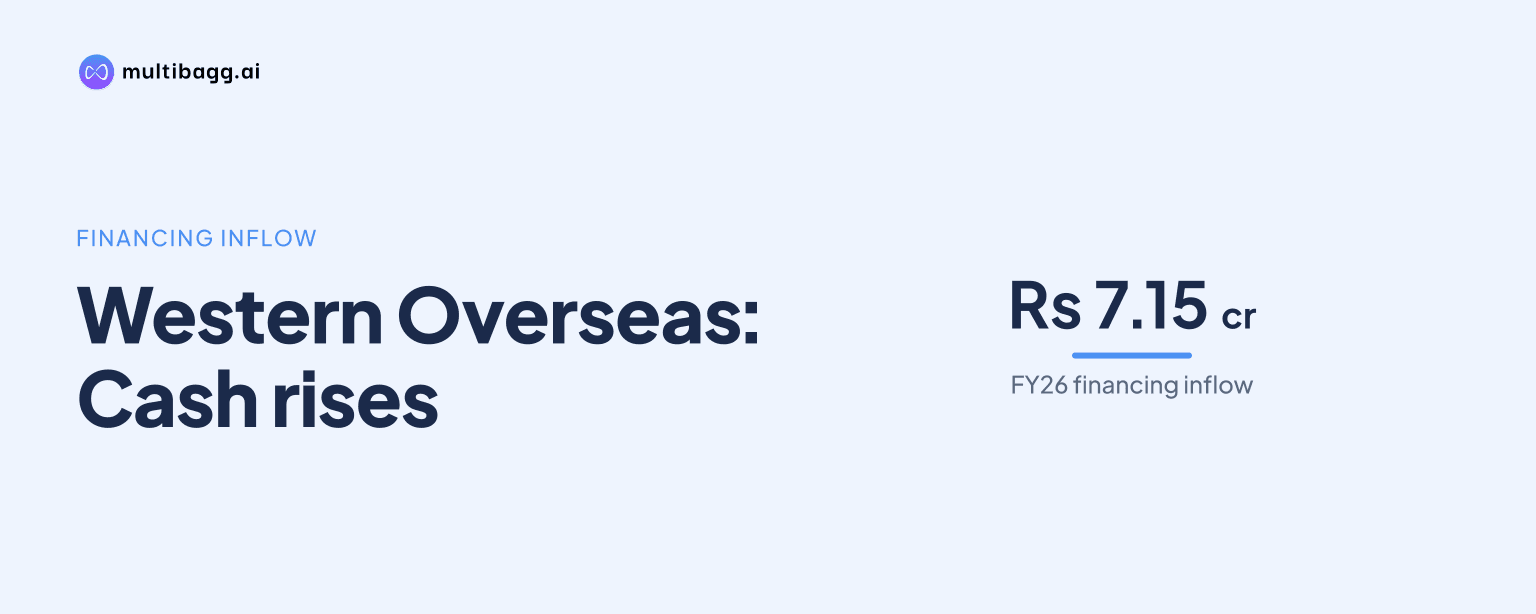
Western Overseas Study Abroad Limited recorded Rs 2.73 crore of FY26 profit after tax, but negative Rs 1.70 crore of operating cash flow; Rs 7.15 crore of financing inflow instead drove a Rs 4.78 crore increase in cash and cash equivalents during the year.
Know Western Overseas Study Abroad inside out
Results, valuation, peers and who's buying, in one view.
Why was Western Overseas operating cash flow negative despite profits?
Western Overseas reported profit after tax, or PAT, in FY24, FY25 and FY26, while cash flow from operating activities was negative in each year. PAT rose from Rs 1.19 crore in FY24 to Rs 2.21 crore in FY25 and Rs 2.73 crore in FY26. Operating cash flow was negative Rs 2.07 crore, negative Rs 4.48 crore and negative Rs 1.70 crore, respectively.
Western Overseas increased FY26 PAT even as revenue fell by Rs 2.46 crore from FY25. Total expenditure declined to Rs 15.78 crore from Rs 18.99 crore, including employee costs of Rs 5.78 crore versus Rs 7.75 crore and other expenses of Rs 10.05 crore versus Rs 11.34 crore. The presentation reports a FY26 PAT margin of 13.5%, compared with 9.7% in FY25 and 5.9% in FY24.
The presentation does not provide a line-by-line reconciliation of the operating cash outflow. Trade receivables nevertheless increased to Rs 3.87 crore at FY26-end from Rs 0.11 crore at FY25-end, while other current assets rose to Rs 6.03 crore from Rs 3.41 crore. These balance-sheet changes coincided with the negative FY26 operating cash flow, but their individual cash-flow effects are not disclosed.
Why did Western Overseas cash increase in FY26?
Western Overseas' cash increased in FY26 because its Rs 7.15 crore financing inflow exceeded the combined negative Rs 1.70 crore operating cash flow and negative Rs 0.68 crore investing cash flow. The resulting Rs 4.78 crore increase in cash and cash equivalents reversed decreases of Rs 0.25 crore in FY24 and Rs 0.20 crore in FY25.
Financing inflow was higher in FY26 than the Rs 4.51 crore reported in FY25 and Rs 2.62 crore in FY24. Investing activities used cash in all three years, at Rs 0.81 crore in FY24, Rs 0.23 crore in FY25 and Rs 0.68 crore in FY26. The cash-flow statement therefore shows that financing, rather than operations, accounted for the FY26 increase in cash.
Cash and bank balance on the balance sheet rose to Rs 4.99 crore at FY26-end from Rs 0.22 crore at FY25-end. This closing balance is reported separately from the cash-flow statement's annual increase in cash and cash equivalents of Rs 4.78 crore. The former is a year-end balance, while the latter records the movement during FY26.
Got a follow-up? Ask IRIS
How did IPO funding change the Western Overseas balance sheet?
Western Overseas' total equity rose to Rs 18.53 crore in FY26 from Rs 6.53 crore in FY25. The presentation attributes the increase to Rs 9.32 crore of primary capital from its initial public offering, or IPO, and retained FY26 earnings. Equity share capital increased to Rs 6.01 crore from Rs 4.21 crore, while reserves and surplus increased to Rs 12.52 crore from Rs 2.31 crore.
Western Overseas had no long-term borrowings at FY26-end, compared with Rs 3.86 crore at FY25-end. The presentation says Rs 2.00 crore of ICICI term debt was partly repaid from IPO proceeds. Short-term borrowings were Rs 2.10 crore in FY26, compared with less than Rs 1 lakh in FY25 and Rs 3.31 crore in FY24.
Total assets reached Rs 22.38 crore in FY26, up from Rs 12.75 crore in FY25. Current assets accounted for Rs 15.63 crore, including Rs 4.99 crore of cash, Rs 3.87 crore of trade receivables and Rs 6.03 crore of other current assets. The presentation reports net cash of Rs 2.89 crore, calculated from Rs 4.99 crore of cash against total debt of Rs 2.10 crore.
Which Western Overseas ratios changed after the FY26 funding event?
Western Overseas' current ratio rose to 4.07 times in FY26 from 1.01 times in FY25 and 0.84 times in FY24. Current assets increased to Rs 15.63 crore while current liabilities were Rs 3.84 crore at FY26-end. The ratio measures current assets against current liabilities.
Western Overseas' debt-to-equity ratio declined to 0.11 times in FY26 from 0.59 times in FY25 and 0.74 times in FY24. Net asset value, or NAV, per share rose to Rs 30.8 from Rs 15.5. Return on equity declined to 21.8% from 40.2%, while return on capital employed declined to 26.7% from 37.6%; the presentation does not explain these changes.
Conclusion
Western Overseas combined rising reported profitability with negative operating cash flow across FY24 to FY26. FY26 PAT reached Rs 2.73 crore and the PAT margin reached 13.5%, but the business reported a negative Rs 1.70 crore operating cash flow. The Rs 4.78 crore rise in cash and the increase in total equity to Rs 18.53 crore were supported by financing inflows and IPO primary capital.
Next, the disclosed unresolved matter is whether operating cash generation changes as FY26-end trade receivables stood at Rs 3.87 crore and other current assets at Rs 6.03 crore. The presentation also says approximately Rs 1.12 crore, or about 11% of IPO proceeds, remained unutilised as of September 30, 2026, making the subsequent use of those proceeds a balance-sheet item to track.