










Western Overseas FY26 EBITDA Margin Reaches 22.4% Despite Revenue Fall
Key highlights
- Western Overseas reported FY26 EBITDA of Rs 4.56 crore, up from Rs 3.96 crore in FY25.
- Western Overseas’s FY26 EBITDA margin increased to 22.4% from 17.3% despite revenue falling to Rs 20.27 crore.
- Employee costs fell to Rs 5.78 crore in FY26 from Rs 7.75 crore in FY25.
- Western Overseas ended FY26 with Rs 4.99 crore of cash and bank balances versus Rs 2.10 crore of total debt.
powered by IRIS
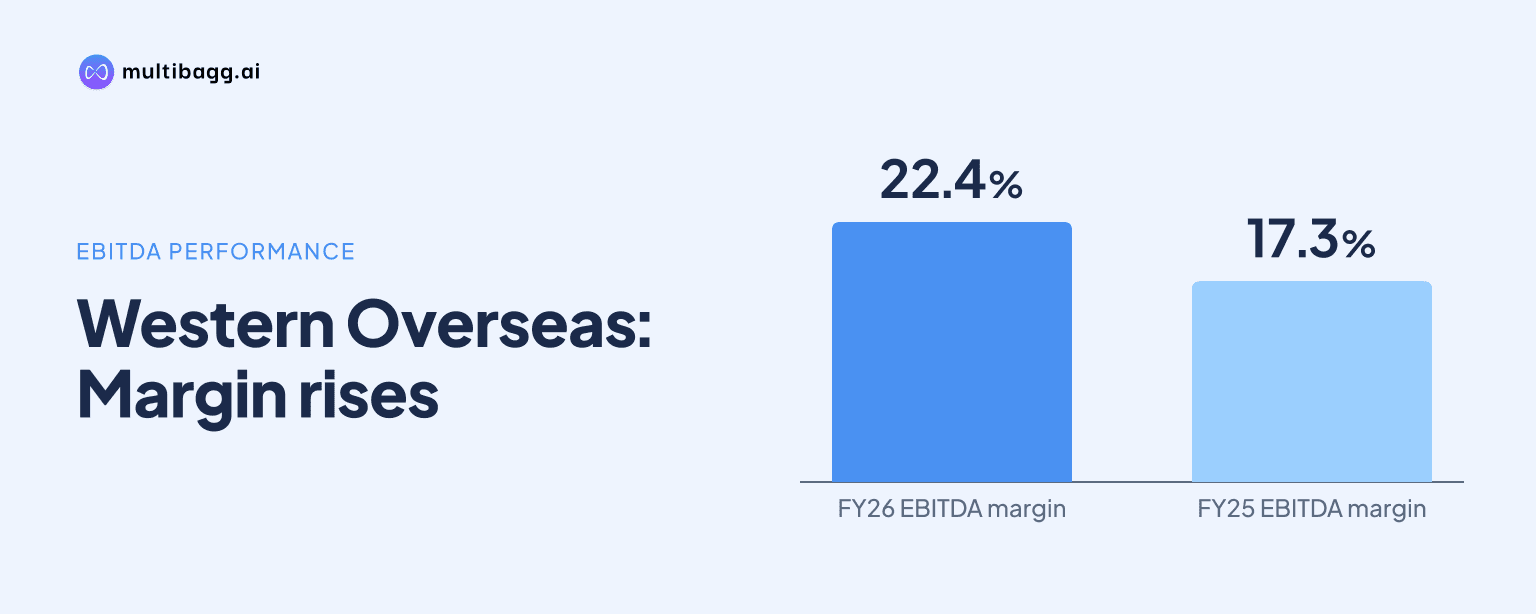
Western Overseas Study Abroad Ltd. increased its FY26 EBITDA margin to 22.4% from 17.3% in FY25 even as revenue from operations fell to Rs 20.27 crore from Rs 22.73 crore. EBITDA rose to Rs 4.56 crore, supported by lower employee costs and management’s stated shift toward exam and processing-fee income.
Know Western Overseas Study Abroad inside out
Results, valuation, peers and who's buying, in one view.
How did Western Overseas expand its FY26 EBITDA margin?
Western Overseas expanded its FY26 EBITDA margin because total expenditure declined more than revenue, enabling EBITDA to increase on a smaller operating-income base. Revenue from operations fell by Rs 2.45 crore between FY25 and FY26, while total expenditure declined by Rs 3.20 crore to Rs 15.78 crore. EBITDA consequently increased by Rs 0.60 crore to Rs 4.56 crore and the EBITDA margin widened by 5.1 percentage points to 22.4%.
The FY26 result extended a three-year pattern of higher EBITDA despite an uneven revenue trend. Revenue rose from Rs 20.30 crore in FY24 to Rs 22.73 crore in FY25, before returning to Rs 20.27 crore in FY26. EBITDA rose in each year, from Rs 2.40 crore in FY24 to Rs 3.96 crore in FY25 and Rs 4.56 crore in FY26, while the EBITDA margin moved from 11.8% to 17.3% and then 22.4%.
Western Overseas reported total income of Rs 20.35 crore in FY26, including Rs 7.07 lakh of other income, compared with total income of Rs 22.95 crore in FY25. The improvement in margin therefore did not depend on a rise in reported operating revenue. The presentation’s three-year trend tables show rounded FY26 revenue of Rs 20.27 crore and EBITDA of Rs 4.56 crore, consistent with the consolidated profit and loss summary.
Which costs changed most at Western Overseas in FY26?
Employee costs were the largest identified contributor to Western Overseas’s lower FY26 expense base, declining to Rs 5.78 crore from Rs 7.75 crore in FY25. The Rs 1.97 crore reduction lowered employee costs to 28.4% of total income from 33.7%. The presentation says payroll productivity improved as the exam-services mix scaled and that revenue per employee increased, although it provides no headcount or revenue-per-employee figure.
Other expenses also fell, to Rs 10.05 crore in FY26 from Rs 11.34 crore in FY25, a reduction of Rs 1.29 crore. Yet other expenses remained 49.4% of total income in both years, according to the company’s cost-structure chart. Finance costs plus depreciation and amortisation, abbreviated as D&A, represented 4.1% of total income in FY26, compared with 3.8% in FY25.
Management attributes part of the mix change to exam and processing fees, which it says carry lower direct costs than commission-chasing counselling. This is a management explanation rather than a disclosed segment-income split. The presentation also says Western Overseas’s 12-office network, comprising one head office and 11 branches, plus a new enterprise resource planning system, or ERP, can absorb volume growth without matching growth in costs.
Got a follow-up? Ask IRIS
Did Western Overseas convert higher EBITDA into FY26 net profit?
Western Overseas converted its higher EBITDA into higher reported profit before tax and profit after tax in FY26. Profit before tax increased to Rs 3.73 crore from Rs 3.09 crore in FY25, while profit after tax increased to Rs 2.73 crore from Rs 2.21 crore. The profit-after-tax margin rose to 13.5% from 9.7%, after standing at 5.9% in FY24.
The EBITDA increase of Rs 0.60 crore was partly offset below the operating line by higher finance costs and tax. Finance costs rose to Rs 41.26 lakh in FY26 from Rs 40.58 lakh in FY25, while tax increased to Rs 99.79 lakh from Rs 87.97 lakh. Depreciation declined to Rs 42.34 lakh from Rs 46.74 lakh, leaving profit after tax higher by Rs 0.52 crore.
Western Overseas reported return on equity, or ROE, of 21.8% in FY26, down from 40.2% in FY25, and return on capital employed, or ROCE, of 26.7%, down from 37.6%. These movements differed from the margin trend as total equity rose to Rs 18.53 crore from Rs 6.53 crore. The company also reported debt-to-equity of 0.11 times in FY26, compared with 0.59 times in FY25.
What do FY26 cash flow and the balance sheet show?
Western Overseas ended FY26 with cash and bank balances of Rs 4.99 crore and total debt of Rs 2.10 crore, which the presentation calculates as net cash of Rs 2.89 crore. Total equity increased to Rs 18.53 crore from Rs 6.53 crore in FY25. Management attributes the increase to Rs 9.32 crore of initial public offering primary capital and retained FY26 earnings.
Cash flow from operating activities remained negative at Rs 1.70 crore in FY26, although this was less negative than Rs 4.48 crore in FY25. Cash flow from financing activities was Rs 7.15 crore in FY26 versus Rs 4.51 crore in FY25, producing a reported net increase in cash and cash equivalents of Rs 4.78 crore. The source therefore distinguishes the cash increase from operating cash generation.
Trade receivables increased to Rs 3.87 crore at FY26 year-end from Rs 10.57 lakh in FY25, while other current assets rose to Rs 6.03 crore from Rs 3.41 crore. The current ratio increased to 4.07 times from 1.01 times. These balance-sheet changes provide context for why FY26 profit after tax of Rs 2.73 crore did not translate into positive operating cash flow.
Conclusion
Western Overseas’s FY26 performance was driven by margin expansion rather than revenue growth. Revenue from operations declined to Rs 20.27 crore, but employee costs fell to Rs 5.78 crore and total expenditure declined to Rs 15.78 crore, lifting EBITDA to Rs 4.56 crore and the EBITDA margin to 22.4%.
The next issue is whether management’s planned operating leverage from its 12-office network and new ERP is reflected in future costs and cash conversion. Investors can also monitor the stated service-income mix, operating cash flow after the FY26 outflow of Rs 1.70 crore, and the movement in FY26 trade receivables of Rs 3.87 crore.