










Book Value Per Share: Indian P/B Spanned 1.71 to 4.42 in 2026
Key highlights
- HDFC Bank Ltd reported BVPS of Rs 354.91 for the year ended 31 March 2026.
- Nifty Bank traded at a P/B of 1.71, versus 4.42 for Nifty Midcap Select, on 8 September 2026.
- The Nifty 50 has used free-float market-capitalisation weighting since 26 June 2009.
- Common Indian share face values include Rs 1, Rs 2, Rs 5 and Rs 10.
powered by IRIS

On 8 September 2026, book value per share showed reported net assets per ordinary share, while the Nifty Bank’s P/B was 1.71 and the Nifty Midcap Select’s was 4.42. BVPS comes from balance-sheet figures, whereas a share price reflects what buyers will pay in the market.
Two answers exist to the question of what a share is worth. The accountant gives one, drawn from the balance sheet; everyone else gives the other, called the market price. They rarely agree. That gap is what the price-to-book ratio measures.
What does BVPS mean?
BVPS takes the net assets belonging to ordinary shareholders and spreads them across every ordinary share in issue.
Total assets minus total liabilities gives net assets, which appears on the balance sheet as the shareholders’ equity line. Divided across the share count, it gives the accounting value standing behind each share. Because it is a recorded figure rather than a market one, it moves when the company reports and not when the price does.
How is BVPS calculated?
BVPS equals total assets minus total liabilities minus preference capital, divided by ordinary shares outstanding.
Preference capital comes out first because those holders rank ahead. That slice was never the ordinary shareholder’s to begin with. Every input is drawn from a reported balance sheet, so the figure is only as current as the last set of results.
Face value is not BVPS. Face value, or par value, is the nominal amount fixed on a share at issue, such as Rs 1, Rs 2, Rs 5 or Rs 10 in common Indian practice, and it stays put through every year of retained profit. BVPS moves as reserves build, which is why a Rs 1 face value can sit under a BVPS hundreds of times larger. Face value helps establish the share count: paid-up equity share capital divided by face value gives the shares outstanding.
How did HDFC Bank Ltd calculate BVPS?
In its audited results for the year ended 31 March 2026, HDFC Bank Ltd (NSE: HDFCBANK) reported equity share capital of Rs 1,539.34 crore at a face value of Rs 1 each, or 1,539.34 crore ordinary shares in issue, and standalone net worth of Rs 5,46,325.46 crore.
Rs 5,46,325.46 crore divided by 1,539.34 crore shares equals Rs 354.91 of BVPS.
That is the calculation: net assets on top and the share count underneath, both read from one filing. The same two inputs sit behind every BVPS figure on Multibagg’s screener, which is why a P/B screen is only as fresh as the last reported results.
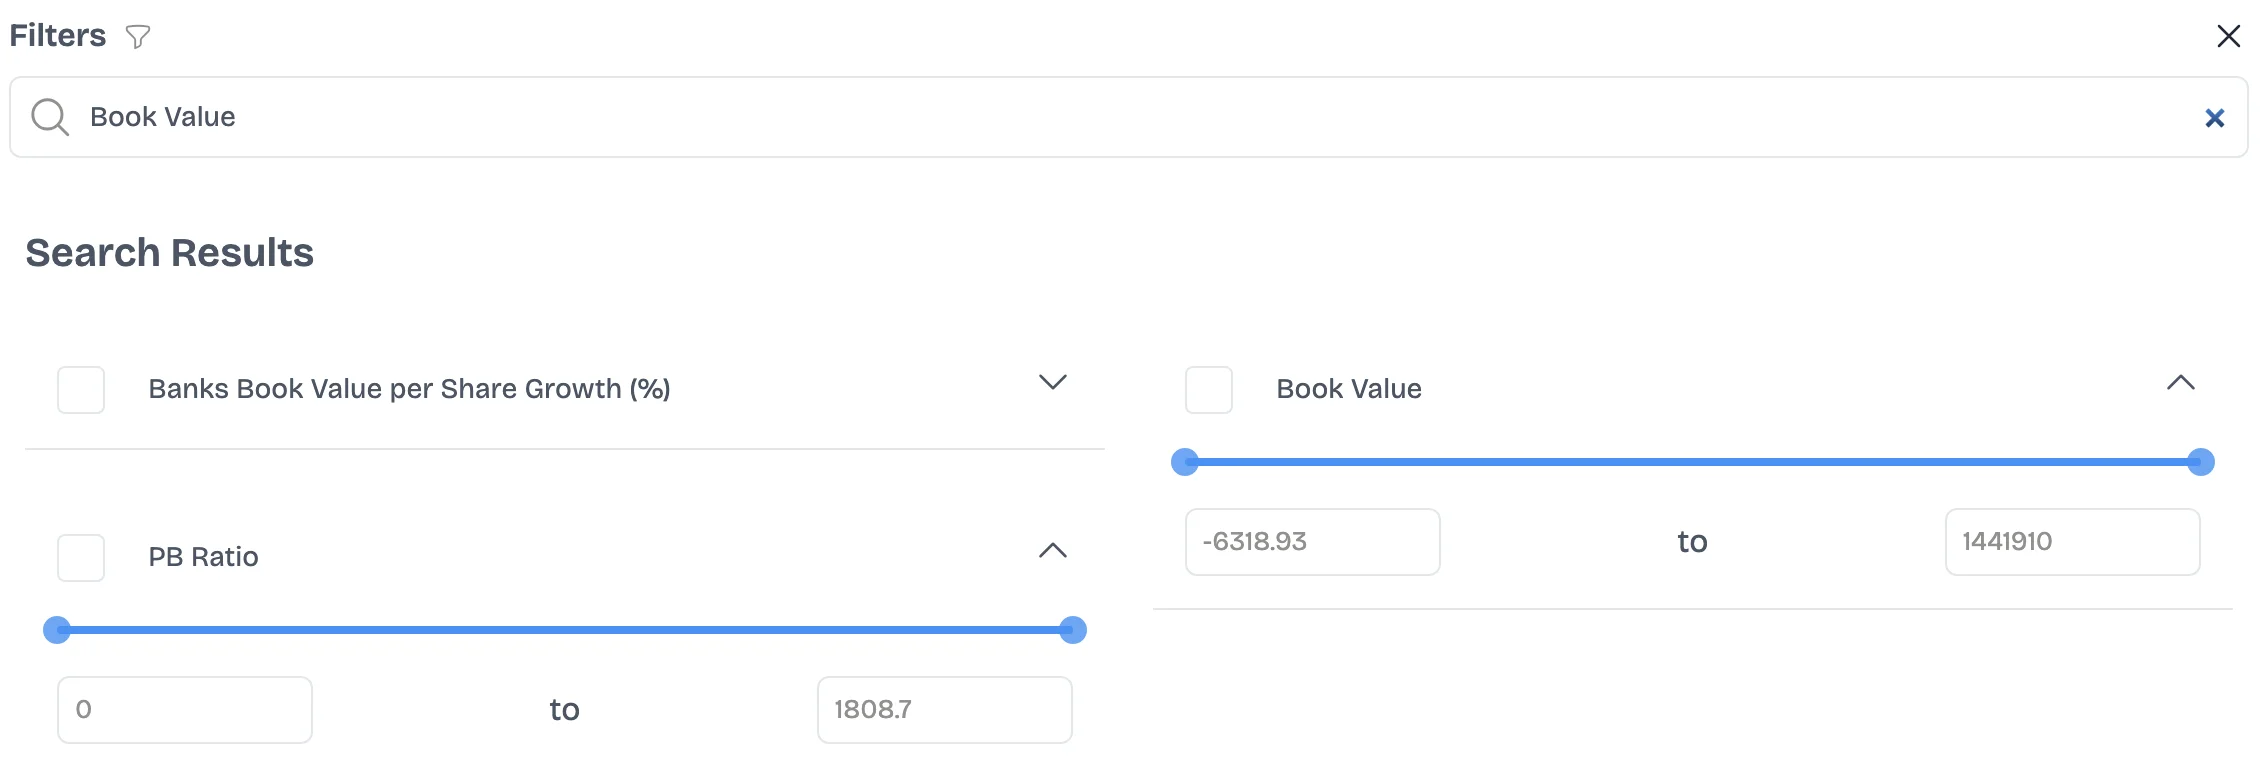
Book value and the P/B ratio are separate filter fields on the screener. Screenshot taken 15 September 2026.
What is tangible BVPS?
Tangible BVPS removes intangible assets, chiefly goodwill and acquired brands, before the division is done.
Goodwill arises when one company buys another for more than the net assets it acquires, and the excess remains on the balance sheet until it is written down. Because it cannot be sold separately from the business, anyone testing what the assets would actually realise takes it out first. The gap is widest at companies built through acquisitions, so two firms with identical reported net assets can be far apart on what those assets are worth.
How does BVPS differ from market value?
BVPS records what assets cost, adjusted over time, while market value reflects what buyers will pay today.
They diverge for a structural reason. Most assets are carried at historical cost less depreciation, so a factory bought 20 years ago sits at a fraction of its replacement cost. Internally built intangibles are largely absent: a brand or an in-house software platform can generate most of a company’s profit and appear nowhere in its net assets.
Set side by side, the two measures disagree on almost every axis that matters.
The same distinction shapes index weighting. NSE Indices has computed the Nifty 50 on free-float market capitalisation since 26 June 2009, so weights follow market value rather than anything on a balance sheet.
Got a follow-up? Ask IRIS
What does the P/B ratio show?
P/B is the share price divided by BVPS, and it states how many times the accounting value the market is paying.
At a P/B of 1, the market is paying exactly the net assets on the books. Above that, it is paying a premium for something the balance sheet never captured, usually earning power. Below it, the market is paying less than recorded net assets, which can reflect doubt about whether those assets are worth their carrying value.
What is a good P/B ratio?
There is no single good P/B ratio because the sector sets the range.
The conventional textbook marker is a P/B under 1, on the reasoning that the market is paying less than recorded net assets. In Indian practice, asset-heavy businesses such as banks are commonly discussed in a band of roughly 1 to 3, while asset-light businesses routinely sit well above it.
Three caveats matter. The spread within one market on one day is wide enough to make any universal threshold meaningless: across the NSE indices below, published P/B ran from 1.71 to 4.42 on 8 September 2026. A low ratio is not automatically a low price because the denominator is overstated if recorded assets will not realise their carrying value. The ratio is also close to useless where the book is small by construction, which covers most software, consumer-brand and services companies. Read P/B against the same company’s history and direct sector peers, and not much else.
What did Indian index P/B figures show in 2026?
Indian index P/B varied by more than a factor of two across indices drawn from the same market on the same day.
Each index below is shown at its settled close with the P/B that NSE publishes against it.
Closes: NSE, as of 7 September 2026. P/B: NSE, as of 8 September 2026.
There is deliberately no book-value-per-index-unit column. Dividing a close by a P/B would produce one, but NSE does not state which level its ratio is struck against, so the figure would rest on an assumption.
The Nifty Bank’s 1.71 against the Nifty Midcap Select’s 4.42 is not a statement that banks are cheaper. Banks hold financial assets carried close to realisable value, which makes their book values large and meaningful against the share price.
A midcap set weighted toward businesses whose worth sits in brands and processes will show a higher multiple of a smaller book. The ratio is doing different work in each case. Current levels are published on NSE’s index tracker, and the benchmark’s constituents are on Multibagg’s Nifty 50 index page.
Can BVPS be compared across companies?
No, BVPS alone is not comparable between companies because it depends on the share count.
Fewer shares outstanding and identical net assets make BVPS look larger. Earnings per share behaves the same way. What is comparable is P/B, and even that holds only within a sector where the assets are of a similar type.
Setting a bank’s P/B beside a software company’s means comparing two accounting situations, not two valuations. Both fields can be filtered side by side on a screen, with per-company figures on the stocks hub.
Why does BVPS matter when there is no market price?
When no traded price exists, the balance sheet is one of the few anchors available.
For a listed company, the market supplies a price every second, and BVPS serves as a cross-check on it. For an unlisted company, there is nothing to check against. That absence is why valuation arguments over private businesses lean heavily on assets, earnings and comparables instead. Disputes over what a private company is worth are arguments about which anchor to trust.
The same problem appears just before a listing, when a price is being set rather than observed. That is what makes pre-listing valuation ranges contested, and why the earnings underneath them are argued over just as hard.
Four errors account for most misread BVPS figures.
- Comparing BVPS between companies: Share counts differ, so the comparison measures share structure rather than assets.
- Reading a P/B below 1 as a bargain: It can equally reflect doubt that the recorded assets are worth their carrying value.
- Comparing P/B across sectors: The Nifty Bank sat at 1.71 and the Nifty Midcap Select at 4.42 on 8 September 2026 because their assets are of different kinds.
- Treating BVPS as current: It updates when results are reported, not when the price moves, so it can be months old.
Conclusion
BVPS is an accounting measure of net assets per ordinary share, not a market estimate of what a share will sell for. P/B connects that reported figure with the market price, but its meaning depends on the nature of the assets, the reliability of their carrying values and comparisons with the same company or direct peers.
The practical takeaway is to check the reporting period behind BVPS before using P/B, then compare the ratio within sectors rather than across businesses with different accounting structures.
Disclaimer: This article is for informational and educational purposes only and is not investment, financial, legal or tax advice. Multibagg AI does not recommend whether to buy, sell or hold any security. Figures are as of the dates stated and may change. Consult a SEBI-registered investment adviser before making any investment decision.