










Wonderla Q2 FY27 EBITDA rose 90% as footfall increased 44%
Key highlights
- Wonderla reported Q2 FY27 EBITDA of Rs 30.11 crore, up 90% year on year.
- Wonderla’s Q2 FY27 footfall increased 44% to 7.25 lakh visitors.
- Wonderla’s Q2 FY27 EBITDA margin rose 6.1 percentage points to 24.0%.
- Wonderla’s H1 FY27 total income increased 41% to Rs 377.78 crore.
powered by IRIS
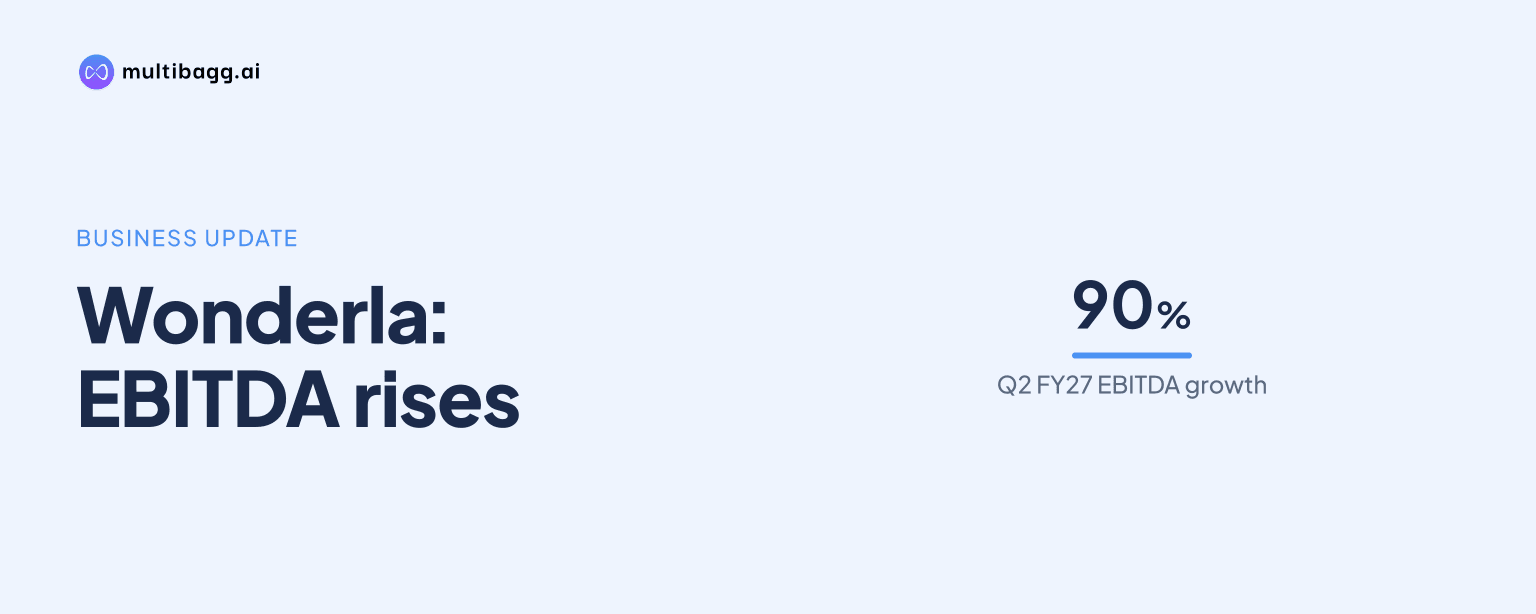
Wonderla Holidays Ltd. reported Q2 FY27 earnings before interest, tax, depreciation and amortisation (EBITDA) of Rs 30.11 crore, up 90% year on year, as footfall rose 44% to 7.25 lakh visitors and EBITDA margin increased to 24.0% from 17.9%. Profit after tax (PAT) moved to Rs 5 lakh from a Rs 1.75 crore loss in Q2 FY26.
Know Wonderla Holidays inside out
Results, valuation, peers and who's buying, in one view.
What drove Wonderla’s Q2 EBITDA increase?
Wonderla’s Q2 FY27 EBITDA increase coincided with 42% growth in total income, including other income, to Rs 125.68 crore and a 44% rise in footfall to 7.25 lakh. EBITDA rose by Rs 14.26 crore from Rs 15.85 crore in Q2 FY26, exceeding the Rs 37.16 crore increase in total income from Rs 88.52 crore.
The reported volume change was 2.20 lakh additional visits, with footfall rising from 5.05 lakh in Q2 FY26. Average revenue per user (ARPU) increased by Rs 13 to Rs 1,491, indicating that total income growth combined substantially higher visitor numbers with broadly stable per-visitor revenue.
EBITDA margin rose 6.1 percentage points to 24.0% from 17.9%, based on the presentation’s reported margins. Cash PAT increased by Rs 11.80 crore to Rs 27.78 crore, although the results slides do not provide an expense-line breakdown for the change in EBITDA margin.
How did Wonderla’s Q2 income and profitability change?
Wonderla recorded Q2 FY27 total income of Rs 125.68 crore and PAT of Rs 5 lakh, compared with Rs 88.52 crore of income and a Rs 1.75 crore PAT loss in Q2 FY26. The reported PAT margin consequently moved from negative 2.0% to 0.0%.
The movement in PAT was smaller than the movement in EBITDA. EBITDA increased 90% to Rs 30.11 crore, while PAT was only marginally positive at Rs 5 lakh; the presentation reports these two measures but does not explain on the supplied results slides the items between them.
The presentation states that Bengaluru Park, Kochi Park and the Resort delivered their best-ever quarterly performance, while Hyderabad Park delivered its best-ever half-yearly performance. Resort revenue rose 57% year on year to Rs 8.82 crore in Q2 FY27, making it a separately disclosed contributor to quarterly income growth.
Got a follow-up? Ask IRIS
Did ticket pricing or in-park spending lift Wonderla’s revenue?
Wonderla’s Q2 FY27 ARPU increased 1% to Rs 1,491 because higher average non-ticket price more than offset a lower average ticket price. Average ticket price declined 3% to Rs 983 from Rs 1,017, while average non-ticket price increased 11% to Rs 510 from Rs 461.
The figures show that visitor growth, rather than ticket-price growth, was the reported driver of the quarter’s expansion. The Rs 49 increase in non-ticket price per visitor exceeded the Rs 34 decline in average ticket price, producing the Rs 13 increase in ARPU alongside the 44% increase in footfall.
Chennai Park reported Q2 FY27 revenue of Rs 27.79 crore, average ticket price of Rs 948, non-ticket spending per head of Rs 510 and ARPU of Rs 1,457. Its footfall was 1.90 lakh, below Bengaluru Park’s 2.13 lakh and Kochi Park’s 2.03 lakh but above Hyderabad Park’s 0.99 lakh and Bhubaneshwar Park’s 0.20 lakh.
What did Wonderla report for the first half of FY27?
Wonderla reported H1 FY27 total income of Rs 377.78 crore, up 41% from Rs 267.58 crore in H1 FY26, while EBITDA increased 47% to Rs 152.10 crore. EBITDA margin rose 1.7 percentage points to 40.3% from 38.6%, a smaller increase than the 6.1-percentage-point expansion reported in Q2 alone.
H1 footfall increased 37% to 19.50 lakh from 14.22 lakh. Average ticket price was reported at Rs 1,192, compared with Rs 1,188 a year earlier, while average non-ticket price rose 16% to Rs 559 from Rs 482; these movements increased H1 ARPU 5% to Rs 1,750.
PAT increased to Rs 72.85 crore from Rs 50.83 crore in H1 FY26, although PAT margin declined to 19.0% from 19.3%. The half-year figures therefore show higher income, EBITDA and PAT, while the reported PAT-margin movement differed from the increase in EBITDA margin.
Conclusion
Wonderla’s Q2 FY27 turnaround combined 44% growth in footfall, 42% growth in total income and 90% growth in EBITDA to Rs 30.11 crore. A Rs 49 increase in non-ticket price per visitor offset a Rs 34 decline in average ticket price, lifting ARPU to Rs 1,491 and widening EBITDA margin to 24.0%.
The supplied presentation gives no FY27 target, expansion plan or scheduled operating milestone. The next reported issue to watch is whether the Rs 983 Q2 average ticket price and the Rs 510 non-ticket price can continue to support ARPU, while the items between EBITDA of Rs 30.11 crore and PAT of Rs 5 lakh remain unexplained in these results slides.