










Z-Tech Q2 Revenue Was 88.8% From Creative Parks Despite Expansion
Key highlights
- Creative parks accounted for 88.8% of Z-Tech’s Rs 43.21 crore Q2 FY26-27 revenue.
- Engineered infrastructure represented 11.2% of Q2 revenue, versus 16.85% in H1 FY26-27.
- Z-Tech disclosed an engineered-infrastructure order book of about Rs 248 crore and an enquiry funnel of about Rs 807 crore.
- Government contracts accounted for 63% of Q2 FY26-27 revenue and North India accounted for 90%.
powered by IRIS
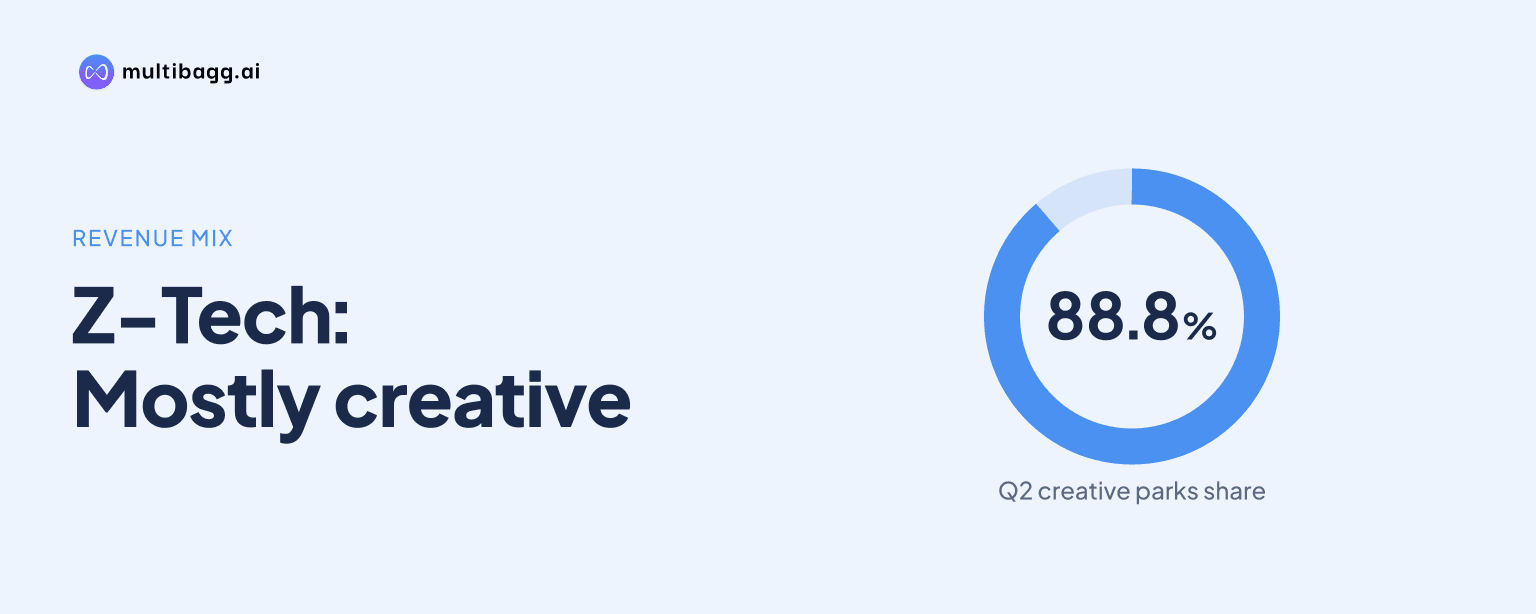
In Q2 FY26-27, Z-Tech (India) Limited generated 88.8% of Rs 43.21 crore revenue from operations from creative parks, while engineered infrastructure contributed 11.2%, showing that parks remained its primary reported revenue source despite an engineered-infrastructure order book of about Rs 248 crore.
Know Z-Tech (India) inside out
Results, valuation, peers and who's buying, in one view.
How concentrated was Z-Tech’s Q2 FY26-27 revenue?
Z-Tech’s Q2 FY26-27 revenue was concentrated in creative parks, which represented 88.8% of revenue from operations, compared with 11.2% for engineered infrastructure. The company reported total quarterly revenue from operations of Rs 43.21 crore, up 25.24% from Rs 34.50 crore in Q2 FY25-26 and up from Rs 29.14 crore in Q1 FY26-27.
The disclosed mix means the revenue contribution from creative parks was almost eight times that of engineered infrastructure in Q2 FY26-27. The presentation does not provide segment revenue in rupees or a prior-quarter segment comparison, so the reported 88.8% and 11.2% shares are the direct measure of the two business lines’ relative quarterly contribution.
The geographic mix was also concentrated. North India contributed 90% of Q2 FY26-27 revenue, while East contributed 9%, South 1%, and West 0.19%. This places the creative-park-heavy quarter alongside a revenue base that was also predominantly generated in one region.
How did Z-Tech’s revenue mix change in the first half?
Z-Tech’s creative parks share was lower in H1 FY26-27 than in Q2 alone, at 83.15% versus 88.8%, while engineered infrastructure’s share was higher at 16.85% versus 11.2%. This indicates that engineered infrastructure accounted for a greater proportion of revenue in the six-month period than it did in the second quarter.
Revenue from operations in H1 FY26-27 reached Rs 72.35 crore, compared with Rs 54.98 crore in H1 FY25-26, a 31.60% year-on-year increase. As Q2 revenue of Rs 43.21 crore exceeded the Q1 figure of Rs 29.14 crore, the second quarter represented a larger portion of first-half revenue and carried a higher creative-parks weighting than the reported H1 mix.
Contract data point to a further shift between the Q2 and H1 views. Government contracts represented 63% of Q2 FY26-27 revenue, with private contracts contributing 37%; in H1 FY26-27, government work was 52.2% and private work 47.8%. Thus, government contracts had a 10.8 percentage-point higher share in Q2 than across the first half.
What is Z-Tech’s engineered-infrastructure expansion plan?
Z-Tech reported an engineered-infrastructure order book of about Rs 248 crore and an enquiry funnel of about Rs 807 crore, compared with completed engineered-infrastructure projects of about Rs 9.7 crore. The presentation describes the order book as a pipeline of long-term contracts and the enquiry funnel as an aggressive pipeline, but it does not specify execution dates, conversion rates, or revenue-recognition timing.
Z-Tech said it had started direct bidding for government projects including those associated with the Ministry of Road Transport and Highways, water resources departments, and Delhi Metro Rail Corporation. It also said it had opened a Vadodara technical laboratory for faster customised solutions and adopted a matrix structure across five sectors and four zones.
Those five sectors are walls and slopes, water, rockfall, environment, and core infrastructure. Management said in its Q2 FY26-27 message that accelerated execution of infrastructure and engineering projects contributed to the quarter’s performance, while its disclosed revenue mix shows that creative parks still supplied 88.8% of revenue in that period.
Got a follow-up? Ask IRIS
What do Z-Tech’s quarterly results say about earnings and costs?
Z-Tech reported earnings before interest, tax, depreciation and amortisation, or EBITDA, excluding other income, of Rs 12.78 crore in Q2 FY26-27, up 82.31% from Rs 7.01 crore in Q2 FY25-26. EBITDA margin rose to 29.57% from 20.32% a year earlier and from 22.82% in Q1 FY26-27, alongside the increase in revenue from Rs 34.50 crore to Rs 43.21 crore year on year.
Profit after tax was Rs 7.89 crore, up 30.19% from Rs 6.06 crore in Q2 FY25-26 and up from Rs 4.05 crore in Q1 FY26-27. Profit-after-tax margin was 18.25%, compared with 17.56% a year earlier and 13.90% in Q1 FY26-27. Basic earnings per share rose to Rs 5.22 from Rs 4.23 in Q2 FY25-26.
Expenses increased with activity. Raw-material costs were Rs 22.43 crore in Q2 FY26-27 versus Rs 22.00 crore a year earlier, employee cost was Rs 4.09 crore versus Rs 2.88 crore, and other expenses were Rs 3.91 crore versus Rs 2.61 crore. Total expenses rose to Rs 30.43 crore from Rs 27.49 crore, while depreciation reached Rs 1.19 crore and interest or finance cost was Rs 1.45 crore.
How is Z-Tech trying to develop its park business?
Z-Tech is developing its park business through ticketing, online booking, marketing and possible operating partnerships. Four of its nine parks were live for phased online booking when the presentation was issued, and its customer-built application captures ticketing, adventure, parking and golf-cart revenue.
Z-Tech said it had begun offline newspaper advertising and was focusing on digital performance marketing after launching online booking. It also said customer surveys were live and that it planned win-back and event-based retargeting campaigns to encourage repeat visits, without providing a footfall, ticket-sales, or conversion target.
Management said it had rebranded the theme-park business as ZyngPark, a unified identity for existing and future theme-park assets. In the Q2 FY26-27 message, management said the rebranding was not expected to have an immediate material financial effect, but described it as part of the longer-term strategy for the experiential-entertainment vertical.
Conclusion
Z-Tech’s Q2 FY26-27 figures show a business whose reported revenue and geography remained concentrated: creative parks supplied 88.8% of Rs 43.21 crore revenue, North India supplied 90%, and government contracts supplied 63%. At the same time, the H1 mix gave engineered infrastructure a larger 16.85% share, while quarterly EBITDA rose 82.31% year on year to Rs 12.78 crore.
The next issue to watch is how management’s stated engineered-infrastructure expansion translates from an about Rs 248 crore order book and about Rs 807 crore enquiry funnel into reported revenue. Investors can also monitor progress in direct government bidding, the five-sector operating structure, and the phased online-booking rollout, with four of nine parks live at the time of the presentation.