










ZTECH Working-Capital Days Hit 110 in FY26 as Borrowings Rise
Key highlights
- ZTECH’s working-capital days increased to 110 in FY26 from 31 in FY25.
- ZTECH’s combined long-term and short-term borrowings rose to Rs 74.95 crore in FY26 from Rs 1.79 crore.
- ZTECH reported FY26 revenue from operations of Rs 155.79 crore and profit after tax of Rs 35.86 crore.
- ZTECH’s total debt-to-equity ratio moved to 0.33 times in FY26 from 0.01 times in FY25.
powered by IRIS
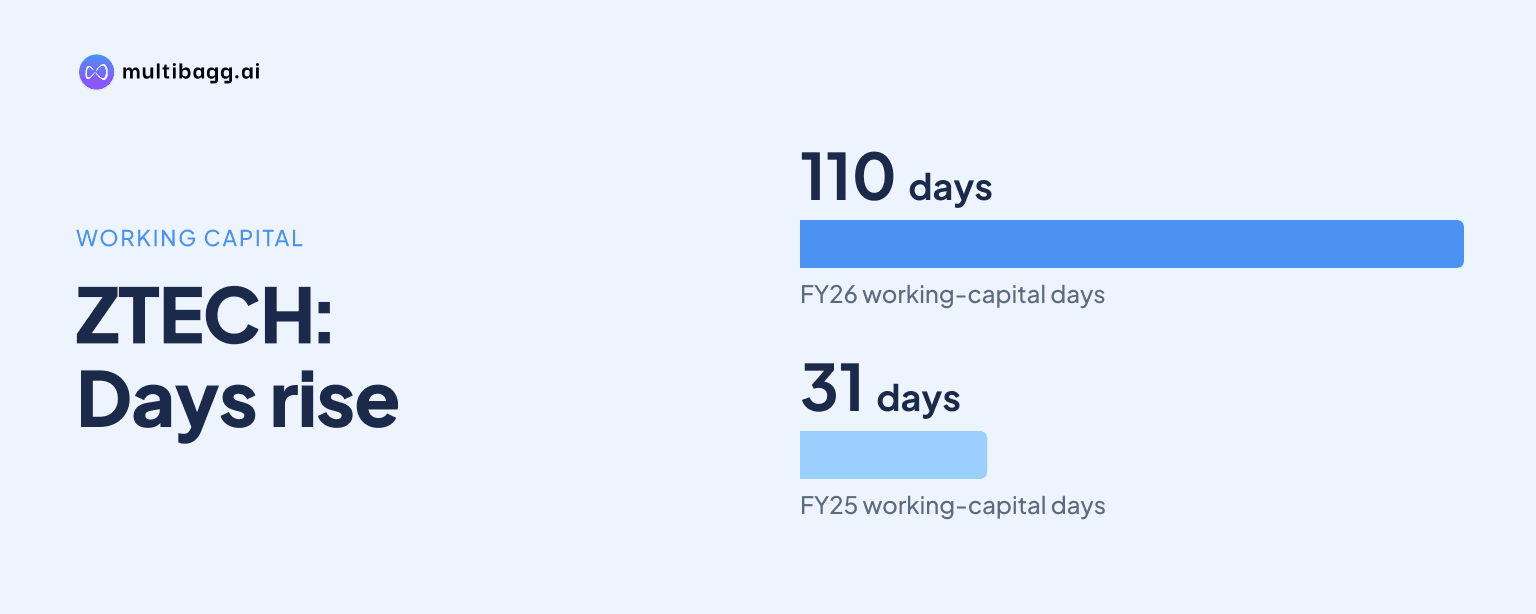
Z-Tech (India) Limited recorded 110 working-capital days in FY26, up from 31 days in FY25, as combined borrowings reached Rs 74.95 crore from Rs 1.79 crore. The FY26 change occurred alongside revenue from operations of Rs 155.79 crore and profit after tax of Rs 35.86 crore.
Know Z-Tech (India) inside out
Results, valuation, peers and who's buying, in one view.
What happened to ZTECH’s working-capital requirement in FY26?
ZTECH’s working-capital days rose by 79 days to 110 in FY26 from 31 in FY25, while its working-capital balance increased by Rs 19.43 crore to Rs 144.94 crore from Rs 125.51 crore. The much larger movement was in the days measure, which increased despite the comparatively smaller increase in the reported working-capital balance.
The FY26 result differed from the prior annual pattern. Working capital was Rs 6.25 crore and 7 days in FY22, then Rs 6.94 crore and 8 days in FY23. It increased to Rs 16.21 crore and 50 days in FY24, before the balance climbed to Rs 125.51 crore in FY25 even as the days measure fell to 31.
Revenue from operations grew to Rs 155.79 crore in FY26 from Rs 94.40 crore in FY25, an increase of Rs 61.39 crore. Earnings before interest, tax, depreciation and amortisation, or EBITDA, rose to Rs 43 crore from Rs 27.81 crore, although EBITDA margin declined to 27.60% from 29.46% over the same period.
The presentation does not break FY26 working capital of Rs 144.94 crore into receivables, inventory, advances, payables or contract assets. It therefore records the increase to 110 days but does not identify which individual balance-sheet component caused the change from 31 days in FY25.
How much did ZTECH’s borrowings increase in FY26?
ZTECH’s combined long-term and short-term borrowings rose to Rs 74.95 crore in FY26 from Rs 1.79 crore in FY25. Long-term borrowings increased to Rs 27.13 crore from Rs 1.57 crore, while short-term borrowings increased to Rs 47.82 crore from Rs 22 lakh, making short-term debt the larger borrowing category in FY26.
The FY26 borrowing position was materially above the levels shown from FY22 through FY25. Combined borrowings were Rs 72 lakh in FY22, Rs 74 lakh in FY23 and Rs 1.31 crore in FY24, before reaching Rs 1.79 crore in FY25. In FY24, long-term borrowing was Rs 78 lakh and short-term borrowing was Rs 53 lakh.
The source does not state that the additional FY26 debt was used to fund working capital. It reports working capital of Rs 144.94 crore and combined borrowings of Rs 74.95 crore in the same year, but provides no use-of-proceeds detail, lender terms, repayment schedule or allocation between projects and operating needs.
Got a follow-up? Ask IRIS
How did ZTECH’s leverage and debt-service measures change?
ZTECH’s total debt-to-equity ratio increased to 0.33 times in FY26 from 0.01 times in FY25, following 0.06 times in FY24. The presentation defines this ratio as total debt divided by equity, and FY26 net worth rose to Rs 223.87 crore from Rs 170.86 crore in FY25.
The debt service coverage ratio fell to 22.87 times in FY26 from 306.65 times in FY25. ZTECH defines the measure as EBITDA divided by finance cost; it was 125.64 times in FY24, 46.71 times in FY23 and 9.46 times in FY22. The FY26 figure was therefore below the FY24 and FY25 readings but above the FY22 and FY23 readings.
Return on equity, or RoE, was 16.02% in FY26, compared with 11.81% in FY25 and 39.15% in FY24. Return on capital employed, or RoCE, was 12.00% in FY26, compared with 11.69% in FY25 and 36.91% in FY24; ZTECH defines RoE as net profit divided by net worth and RoCE as profit after tax divided by shareholders’ funds plus total debt.
Finance cost became more visible in the following half year. Interest and finance cost was Rs 2.91 crore in H1 FY26-27, up from Rs 28 lakh in H1 FY25-26, while revenue from operations rose 31.60% to Rs 72.35 crore and profit after tax rose 31.20% to Rs 11.94 crore.
Did ZTECH’s earnings growth continue after the FY26 balance-sheet shift?
ZTECH remained profitable in FY26, reporting profit after tax of Rs 35.86 crore compared with Rs 20.18 crore in FY25. Profit-after-tax margin increased to 23.02% from 21.38%, while revenue from operations rose to Rs 155.79 crore from Rs 94.40 crore in the same year that working-capital days reached 110.
The FY26 outcome extended an uneven but expanding revenue record. Revenue fell from Rs 30.84 crore in FY22 to Rs 25.73 crore in FY23, then rose to Rs 67.32 crore in FY24, Rs 94.40 crore in FY25 and Rs 155.79 crore in FY26. Profit after tax increased from Rs 7 lakh in FY22 to Rs 1.97 crore in FY23, Rs 8.47 crore in FY24, Rs 20.18 crore in FY25 and Rs 35.86 crore in FY26.
In H1 FY26-27, EBITDA excluding other income rose to Rs 19.41 crore from Rs 12.03 crore in H1 FY25-26, and EBITDA margin improved to 26.82% from 21.88%. Profit-after-tax margin was 16.50%, however, marginally below 16.55% in the corresponding prior half year.
Revenue mix also shifted between the disclosed H1 FY26-27 and Q2 FY26-27 data. Creative Parks accounted for 83.15% of H1 revenue and Engineered Infra for 16.85%, compared with 88.80% and 11.20%, respectively, in Q2. Government contracts represented 52.2% of H1 revenue, versus 63% in Q2, while private contracts accounted for 47.8% and 37%.
Conclusion
ZTECH’s FY26 results combine higher operating scale with greater balance-sheet intensity. Revenue increased to Rs 155.79 crore and profit after tax to Rs 35.86 crore, while working-capital days climbed to 110 and combined borrowings reached Rs 74.95 crore. The associated debt-to-equity ratio increased to 0.33 times, while the debt service coverage ratio declined to 22.87 times.
Management’s disclosed plan includes expanding Z yng Parks through pay-per-use sports and adventure options, exploring Tier 3 locations, and adding projection mapping plus augmented-reality and virtual-reality offerings. Future disclosures on borrowing mix, working-capital days and finance cost, which was Rs 2.91 crore in H1 FY26-27, will show how these plans develop alongside the FY26 balance-sheet position.