










Zydus India formulations grows 18.3% as chronic mix expands
Key highlights
- Zydus India formulations sales reached Rs 1,884.4 crore in Q2 FY27, up 18.3% year on year.
- Zydus branded India business grew 19% year on year in Q2 FY27 and was reported to have outperformed the IPM.
- Zydus secondary sales rose 20% year on year, with volume and new products contributing around two-thirds of growth.
- Zydus chronic and sub-chronic products represented 56.9% of India formulations, up 450 basis points over four years.
powered by IRIS
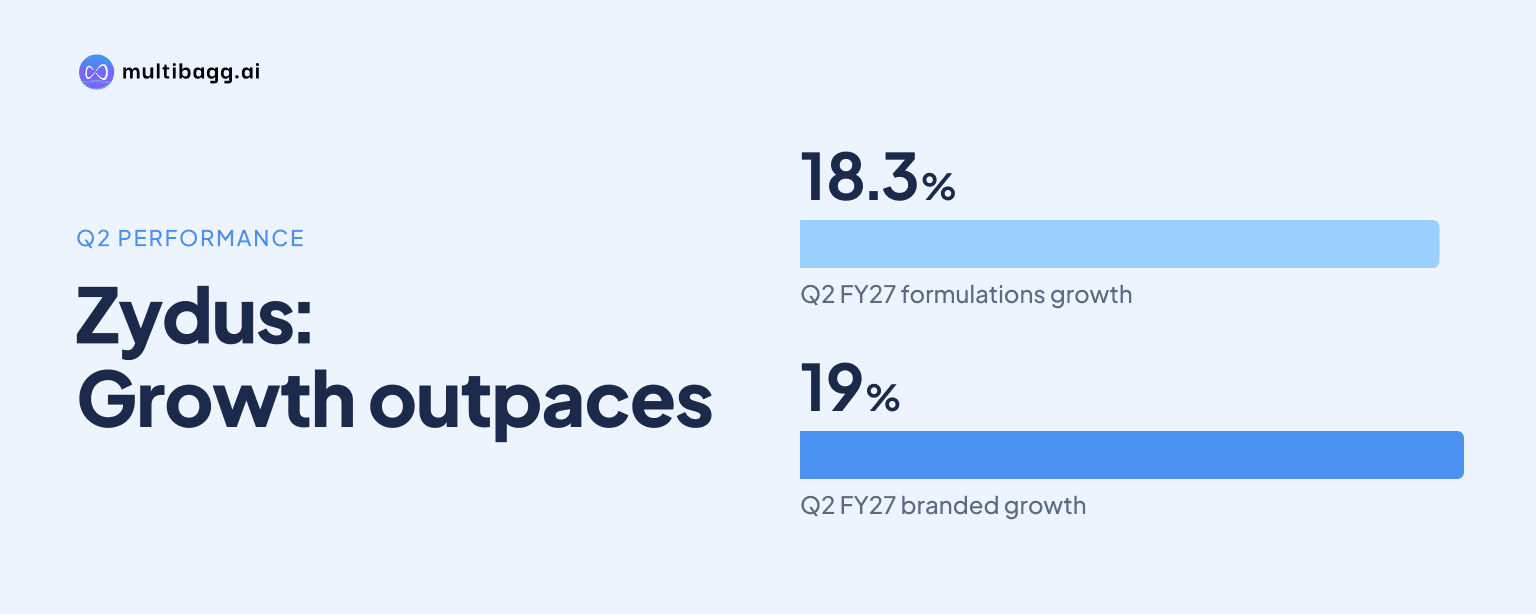
Zydus reported India formulations sales of Rs 1,884.4 crore in Q2 FY27, up 18.3% year on year, as its branded business grew 19% and chronic and sub-chronic products reached 56.9% of the portfolio, a 450-basis-point increase over four years, according to the presentation.
Know Zydus Lifesciences inside out
Results, valuation, peers and who's buying, in one view.
How fast did Zydus India formulations grow in Q2 FY27?
Zydus India formulations grew 18.3% year on year and 3.8% quarter on quarter to Rs 1,884.4 crore in Q2 FY27. The business represented 24% of Zydus revenue contribution in the quarter, making it the second-largest disclosed business after North America formulations, which accounted for 43%.
Sales increased from Rs 1,592.6 crore in Q2 FY26 to Rs 1,884.4 crore in Q2 FY27, a rise of Rs 291.8 crore over the year. The sequential increase was Rs 68.6 crore from Rs 1,815.8 crore in Q1 FY27, which was smaller than the year-on-year increase.
Zydus said its branded India business grew 19% year on year in Q2 FY27, compared with 18.3% growth for India formulations sales overall. The presentation says branded growth was faster than the Indian Pharmaceutical Market, or IPM, but does not disclose the IPM growth rate or the percentage-point difference.
What drove Zydus India formulations growth?
Zydus attributed Q2 FY27 growth to its chronic portfolio, innovation and differentiated products. Secondary sales rose 20% year on year, exceeding the 18.3% growth in reported India formulations sales during the same quarter.
Volume and new products accounted for around two-thirds of the 20% secondary-sales growth, according to Zydus. The presentation does not provide separate growth rates or rupee contributions for volume, new-product launches, pricing or the remaining approximately one-third of secondary-sales growth.
Brand building was another stated growth mechanism, with 20 mother brands valued above Rs 10 crore each, 29 valued from Rs 5 crore to Rs 10 crore, and 28 valued from Rs 2.5 crore to Rs 5 crore. These three disclosed bands contain 77 mother brands with values of at least Rs 2.5 crore.
Which therapies are most important to Zydus India formulations?
Zydus reported that cardio-diabetes was the largest disclosed therapy category at 18% of the India formulations mix in Q2 FY27. Respiratory contributed 13%, oncology 10%, and nephrology and gastro-intestinal therapies contributed 9% each.
The five categories disclosed at 18%, 13%, 10%, 9% and 9% together represented 59% of the therapy mix. Pain accounted for 7%, gynaecology and dermatology each contributed 5%, vitamins, minerals and nutrition contributed 4%, and other therapies accounted for 8%.
Chronic and sub-chronic products represented 56.9% of the portfolio, up 450 basis points over four years. A basis point is one-hundredth of a percentage point, so the disclosed rise equals 4.5 percentage points; the presentation identifies this mix change as part of a portfolio that also includes differentiated and super-specialty products.
Zydus said it gained share in cardiology, diabetology, respiratory, dermatology, gastro-intestinal and anti-infective therapies, as well as in oncology and nephrology. It also reported improved rankings in cardiology, diabetology, gastro-intestinal and anti-infective therapies, while retaining its leadership position in oncology; individual shares and rankings were not disclosed.
Got a follow-up? Ask IRIS
Did Zydus outperform the Indian Pharmaceutical Market?
Zydus said its branded India business outperformed the IPM in Q2 FY27, with branded sales growth of 19% year on year. It also said it had consistently outperformed IPM growth over the last three financial years and during the first half of the current fiscal year.
The market-performance statements use AWACS moving annual total data for September 2026. Zydus supports the statement with a 20% increase in secondary sales and share gains in named therapies, but the presentation does not provide the underlying IPM growth figure, a market-share percentage or an absolute ranking for the India formulations business.
The 56.9% chronic and sub-chronic portfolio share provides context for the outperformance statement because Zydus specifically named chronic products as a Q2 FY27 growth driver. Oncology and nephrology, the two super-specialty areas where Zydus reported share gains, together accounted for 19% of the therapy mix.
How does Zydus India formulations compare with other businesses?
Zydus India formulations was larger than international markets formulations and Consumer Wellness in Q2 FY27, based on reported sales of Rs 1,884.4 crore versus Rs 1,000.9 crore and Rs 1,122.3 crore, respectively. North America formulations remained larger at Rs 3,314.5 crore.
India formulations grew 18% in the business-wise sales summary, while North America formulations grew 21%, international markets formulations grew 33% and Consumer Wellness grew 76%. The presentation reports a more precise 18.3% rate for India formulations on its dedicated business page, compared with the rounded 18% rate in the group sales summary.
At group level, Zydus reported total revenue from operations of Rs 7,909.6 crore in Q2 FY27, up 29% year on year. Pharmaceutical business accounted for 83% of business-wise sales and grew 22%, placing India formulations within a pharmaceutical portfolio that also includes North America and international markets operations.
Conclusion
Zydus delivered 18.3% year-on-year India formulations sales growth in Q2 FY27, supported by a 19% increase in branded business and 20% growth in secondary sales. Volume and new products made up around two-thirds of secondary-sales growth, while the chronic and sub-chronic mix reached 56.9% and the company reported share gains across chronic, acute and super-specialty therapies.
The next disclosed measure to watch is whether Zydus continues to report IPM outperformance, secondary-sales growth and therapy-level share gains in the second half of FY27. Management identifies chronic products, innovation, differentiated portfolios, volume expansion and new products as the mechanisms behind growth, but the presentation does not disclose a numerical IPM benchmark, individual therapy shares or specific India launch targets.