
Actions
Action Type





IRIS
Multibagg AI is an AI powered stock research and analysis platform. We provide data, information, content, and analytics for publicly traded Indian companies listed on NSE and BSE. AI can make mistakes, check important information.
Prices might be delayed by a few minutes.
Join our Exclusive Community


Join our Exclusive Community
Made with 💙 in India. © Finsky Technologies Pvt Ltd. 2026


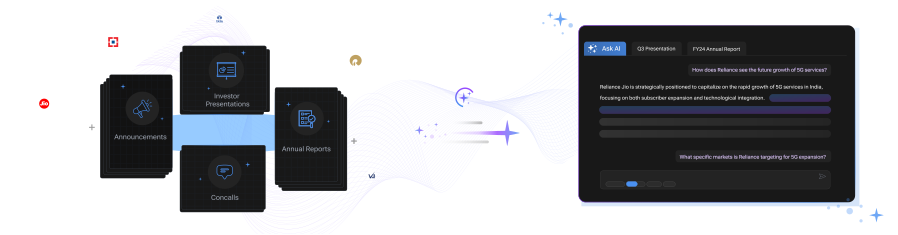
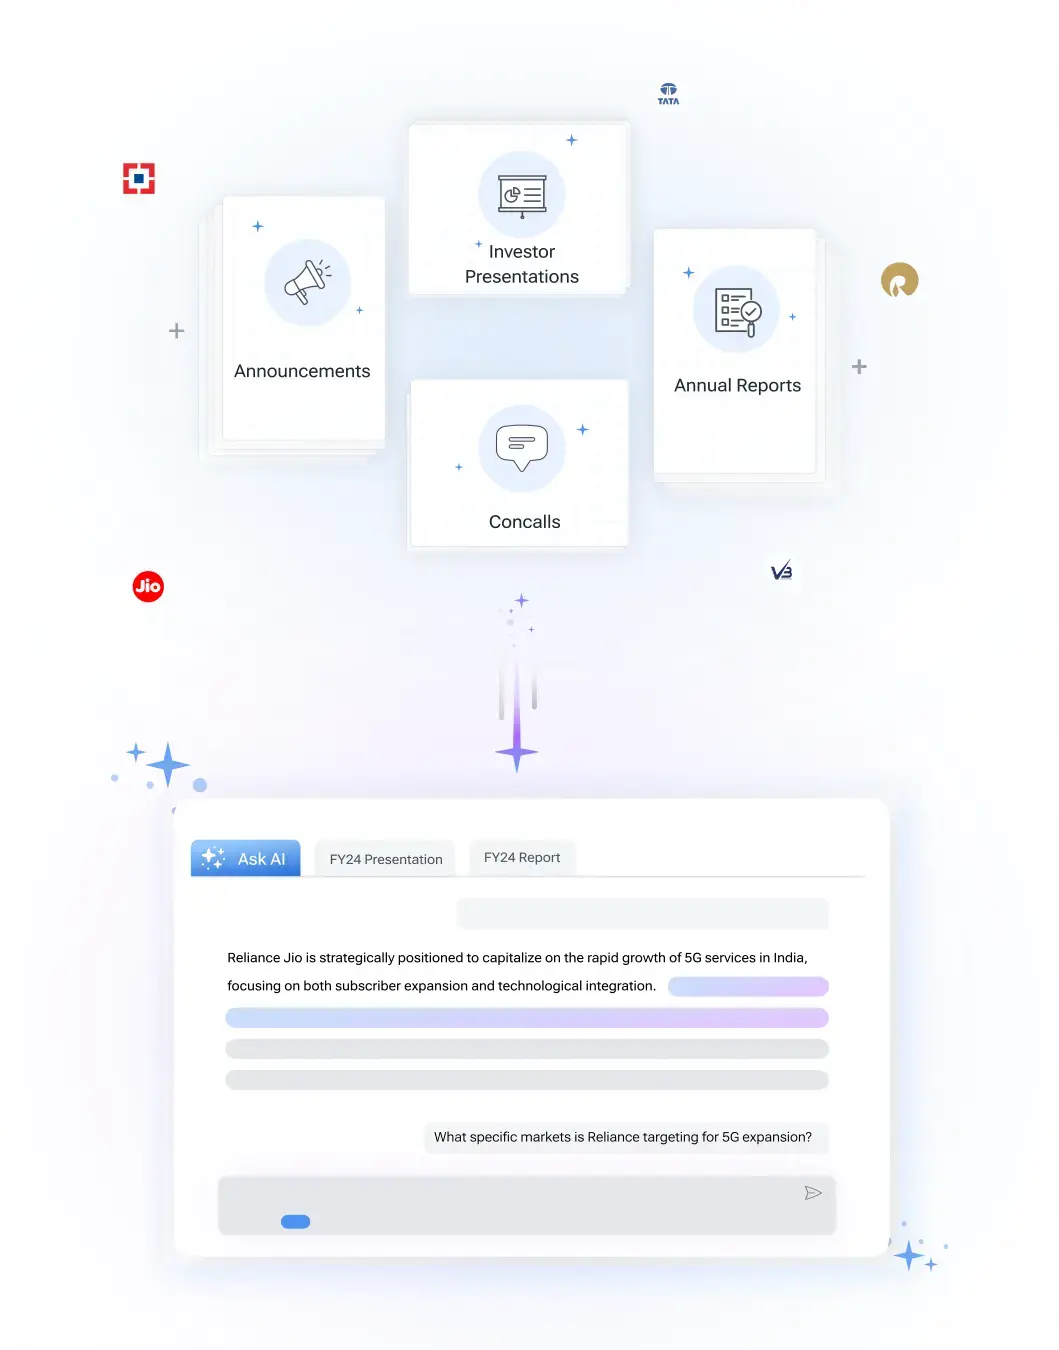
Get instant AI-powered insights about company performance, financials, and strategy. Ask questions about trends, competition, and developments while receiving responses backed by official documents and market data, with clear attribution to source documents.


 Discovery themes featuring this stock


Investor Presentation
Q2 FY27
Investor Presentation
Q2 FY26
Bearish
2
Neutral
7
Bullish
5
Bearish
34
Neutral
7
Bullish
5
Bearish
32
Neutral
0
Bullish
0
Bearish
32
Neutral
0
Bullish
0
Bearish
32
Neutral
0
Bullish
0
Bearish
32
Neutral
0
Bullish
0
| Symbol | Watchlist | Price | Market Cap | P/E | P/B | Div Yield (%) | ROE (%) | ROCE (%) | ROA (%) |
480.00 | 219 Cr | 144.32 | 7.54 | 0.00 | 4.38 | 11.09 | 4.84 | ||
27.00 | 188 Cr | 6.74 | 0.75 | 0.00 | 11.17 | 17.11 | 6.13 | ||
9.77 | 128 Cr | 10.75 | 1.50 | 0.00 | 13.56 | 13.91 | 5.03 | ||
3.00 | 83 Cr | 40.26 | 1.52 | 0.00 | -1.00 | 4.69 | 1.73 | ||
46.64 | 42 Cr | -26.10 | 5.61 | 0.00 | -25.79 | 1.95 | -4.28 | ||
14.20 | 35 Cr | 2.73 | 0.28 | 0.00 | 10.36 | 12.35 | 7.41 | ||
9.32 | 30 Cr | 80.05 | 0.55 | 0.00 | 0.68 | 2.08 | 0.60 | ||
| Median: 7 Co. | — | 14.20 | 83 Cr | 10.75 | 1.50 | 0.00 | 4.38 | 11.09 | 4.84 |
View Standalone
View Standalone
View Standalone
View Standalone
View Standalone
View Standalone
View Standalone
View Standalone

La Tim Metal & Industries Ltd (LATIMMETAL) is currently trading at 9.57 per share. Stock prices fluctuate during market hours on NSE and BSE based on demand, company updates, and overall market conditions. Refer to the live price chart above for the most recent price movement.
La Tim Metal & Industries Limited manufactures and deals in colour-coated steel coils, design-coated steel, stone-coated roofing and asphalt shingles, while also pursuing industrial land development through its La Tim Industrial Park. Its products serve construction, infrastructure, hospitality, premium real estate, interiors, exteriors, appliance and furniture applications across a pan-India distribution network. Q2 FY27 demonstrated substantial operating momentum: revenue increased 68.5% year-on-year to ₹150.4 crore, EBITDA rose 125.3% to ₹7.5 crore and PAT grew 170.3% to ₹3.9 crore. Margin expansion indicates improved operating leverage and a more favourable contribution from OEM-oriented, value-added and premium industrial products. The company is strategically shifting from trade distribution toward OEM-driven business, customised applications and value-added coating solutions. This transition could improve customer stickiness and product mix, although the presentation does not disclose the precise revenue contribution, customer concentration or profitability of the OEM segment. La Tim’s balance sheet is supporting growth through higher borrowings, with debt-to-equity rising from 0.6 times in FY26 to 0.9 times in H1 FY27. At the same time, operating cash flow was negative ₹12.7 crore, while inventories and receivables increased substantially, highlighting working-capital intensity behind the reported expansion. The 1,554.9-guntha land parcel near Tala, connected to Mumbai, Pune, Dighi Port and Nhava Sheva, offers a potential second value-creation pathway. However, the Industrial Park remains a planned, land-parceling-led opportunity rather than an established revenue engine, with development phasing, approvals, monetisation timing and returns yet to be detailed.
Over the past 52 weeks, La Tim Metal & Industries Ltd has traded between a low of ₹7.10 and a high of ₹12.33. The 52-week high and low indicate the stock’s price range over the last year and help investors understand its volatility and recent trading levels.
La Tim Metal & Industries Ltd has a market capitalization of approximately 127.74. Market capitalization represents the total value of a company’s outstanding shares and helps investors understand its size, stability, and relative risk compared to other listed companies.
La Tim Metal & Industries Ltd’s investment profile depends on its business fundamentals, valuation, and long-term outlook. The stock currently trades at a PE ratio of 10.75 and operates in the its sector sector. Investors typically assess financial performance, growth prospects, and individual risk tolerance before making investment decisions.
Based on its market capitalization of 127.74 Cr, La Tim Metal & Industries Ltd is classified as a Small Cap stock. Large-cap stocks are generally more stable, while mid-cap and small-cap stocks tend to offer higher growth potential along with higher price volatility.
La Tim Metal & Industries Ltd operates in the its sector sector. Sector classification matters because companies in the same sector are often affected by similar economic conditions, regulatory changes, and competitive dynamics, which can influence overall stock performance.
The Price-to-Earnings (PE) ratio of La Tim Metal & Industries Ltd is 10.75. The PE ratio compares a company’s share price to its earnings and is commonly used to assess valuation. Comparing the PE ratio with sector peers and historical levels provides better context.
La Tim has identified approximately 1,554.9 gunthas for its Industrial Park venture. The presentation does not state how many industrial plots will be created or how much of the parcel will be saleable after development.
La Tim reported ROCE of 21.5% in FY26, compared with 4.6% in FY25. The presentation also reports ROCE of 23.5% for H1 FY27, which is a partial-period measure rather than a full-year result.
La Tim reported Rs 12.7 crore of net cash used in operating activities in H1 FY27. Its presentation does not provide a detailed operating cash-flow reconciliation, but inventories rose by Rs 10.1 crore and trade receivables rose by Rs 36.9 crore from FY26.
La Tim reported revenue from operations of Rs 150.4 crore in Q2 FY27. The figure represented year-on-year growth of 68.5%, according to its investor presentation.





La Tim Metal & Industries Limited manufactures and deals in colour-coated steel coils, design-coated steel, stone-coated roofing and asphalt shingles, while also pursuing industrial land development through its La Tim Industrial Park. Its products serve construction, infrastructure, hospitality, premium real estate, interiors, exteriors, appliance and furniture applications across a pan-India distribution network.
Q2 FY27 demonstrated substantial operating momentum: revenue increased 68.5% year-on-year to ₹150.4 crore, EBITDA rose 125.3% to ₹7.5 crore and PAT grew 170.3% to ₹3.9 crore. Margin expansion indicates improved operating leverage and a more favourable contribution from OEM-oriented, value-added and premium industrial products.
The company is strategically shifting from trade distribution toward OEM-driven business, customised applications and value-added coating solutions. This transition could improve customer stickiness and product mix, although the presentation does not disclose the precise revenue contribution, customer concentration or profitability of the OEM segment.
La Tim’s balance sheet is supporting growth through higher borrowings, with debt-to-equity rising from 0.6 times in FY26 to 0.9 times in H1 FY27. At the same time, operating cash flow was negative ₹12.7 crore, while inventories and receivables increased substantially, highlighting working-capital intensity behind the reported expansion.
The 1,554.9-guntha land parcel near Tala, connected to Mumbai, Pune, Dighi Port and Nhava Sheva, offers a potential second value-creation pathway. However, the Industrial Park remains a planned, land-parceling-led opportunity rather than an established revenue engine, with development phasing, approvals, monetisation timing and returns yet to be detailed.
Metals & Minerals Trading
Trading - Metals
128 Cr
Moderate Risk
10.8
99.5
0.0
1.5
12.33
7.10
Sales CAGR
Profit CAGR
ROE
ROCE


