










La Tim Metal FY26 ROCE rose to 21.5% as margins recovered
Key highlights
- La Tim Metal’s ROCE increased to 21.5% in FY26 from 4.6% in FY25.
- Revenue from operations rose 52.2% to Rs 390.5 crore in FY26, while EBITDA increased to Rs 15.7 crore from Rs 1.2 crore.
- La Tim reported PAT of Rs 8.2 crore in FY26 after a Rs 0.9 crore loss in FY25.
- H1 FY27 EBITDA margin improved to 5.0% from 4.4%, while operating cash flow turned negative at Rs 12.7 crore.
powered by IRIS
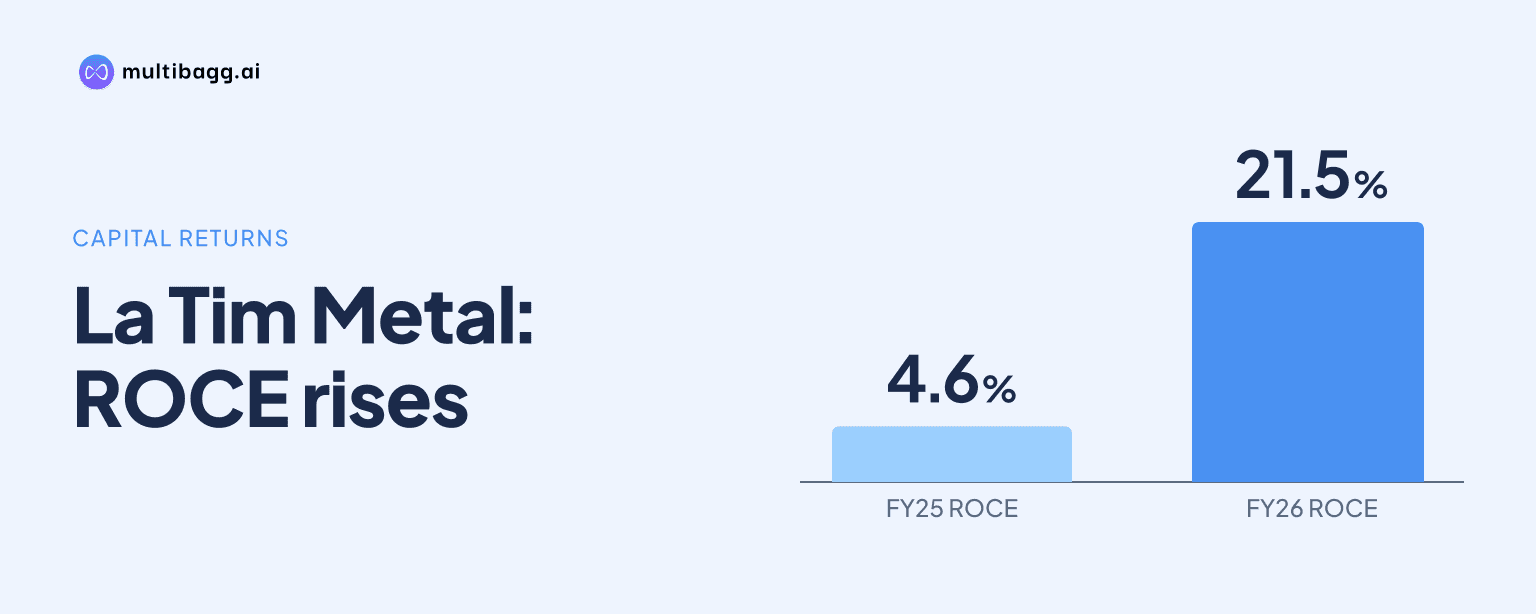
La Tim Metal lifted return on capital employed to 21.5% in FY26 from 4.6% in FY25 as revenue rose to Rs 390.5 crore, EBITDA reached Rs 15.7 crore and profit after tax turned positive at Rs 8.2 crore. Working-capital turnover also increased, although H1 FY27 brought higher borrowings and negative operating cash flow.
Know La Tim Metal & Industries inside out
Results, valuation, peers and who's buying, in one view.
What drove La Tim’s FY26 ROCE turnaround?
La Tim’s return on capital employed, or ROCE, rose 16.9 percentage points to 21.5% in FY26 from 4.6% in FY25, alongside a reversal in reported profitability. Revenue from operations increased 52.2% to Rs 390.5 crore from Rs 256.6 crore, while earnings before interest, tax, depreciation and amortisation, or EBITDA, rose to Rs 15.7 crore from Rs 1.2 crore.
The improvement extended below EBITDA. La Tim reported profit after tax, or PAT, of Rs 8.2 crore in FY26, compared with a Rs 0.9 crore loss in FY25. PAT margin moved to 2.1% from negative 0.3%, while EBITDA margin increased to 4.0% from 0.5%. The presentation links the positive net margin to higher-realisation products and operating scale.
Return on equity, or ROE, moved to 10.4% in FY26 from negative 1.2% in FY25. Return on investment rose to 10.1% from 2.5%, according to the operational-metrics disclosure. These measures changed in the same year that La Tim moved from a net loss to reported PAT of Rs 8.2 crore.
How did La Tim’s working-capital efficiency change in FY26?
La Tim increased net capital turnover to 5.5 times in FY26 from 5.0 times in FY25, while trade receivable turnover rose to 14.1 times from 12.0 times. Trade payable turnover declined to 9.6 times from 18.0 times, meaning the company’s reported payable-turnover measure was lower than in the prior year.
Inventory turnover is disclosed differently on two pages of the presentation. The operational-metrics page gives FY26 inventory turnover as 4.2 times, against 3.6 times in FY25, while the financial-graphs page gives 3.8 times for FY26 against the same 3.6-times FY25 comparison. Both figures show an improvement from FY25, but the presentation does not reconcile the two FY26 values.
Closing working-capital balances rose during FY26. Inventory was Rs 92.0 crore at FY26 end, up from Rs 66.6 crore at FY25 end, and trade receivables increased to Rs 28.5 crore from Rs 21.4 crore. Trade payables rose to Rs 38.9 crore from Rs 12.0 crore, alongside the Rs 133.9 crore increase in annual revenue.
The higher turnover measures and larger closing balances show two aspects of the FY26 operating model. La Tim reported faster movement in receivables and net capital under its turnover calculations, while holding Rs 25.4 crore more inventory and Rs 7.1 crore more receivables at year end. The presentation’s stated mechanism is greater working-capital deployment to generate top-line growth.
Got a follow-up? Ask IRIS
Did La Tim sustain earnings growth in H1 FY27?
La Tim sustained reported earnings growth in H1 FY27, with revenue increasing 62.7% year on year to Rs 287.7 crore and EBITDA rising 85.2% to Rs 14.3 crore. EBITDA margin reached 5.0%, compared with 4.4% in H1 FY26, while PAT more than doubled to Rs 7.1 crore from Rs 3.5 crore. PAT margin increased to 2.5% from 2.0%.
The Q2 FY27 result followed the same direction. Revenue was Rs 150.4 crore, 68.5% above Rs 89.2 crore in Q2 FY26, and EBITDA rose to Rs 7.5 crore from Rs 3.3 crore. Q2 EBITDA margin increased to 5.0% from 3.7%, while PAT was Rs 3.9 crore compared with Rs 1.4 crore a year earlier.
H1 FY27 included a lower contribution from other income than the comparable period. Other income declined to Rs 0.4 crore from Rs 2.5 crore, while finance costs decreased to Rs 3.1 crore from Rs 4.6 crore. In Q2 alone, finance costs rose 13.4% year on year to Rs 1.6 crore, even as profit before tax and exceptional items reached Rs 5.4 crore from Rs 1.7 crore.
Returns also remained above FY26 levels in the H1 FY27 disclosures. ROCE was 23.5%, compared with 21.5% in FY26, and ROE was 13.8%, compared with 10.4%. Net capital turnover increased to 5.9 times from 5.5 times, although H1 FY27 is a partial period and is not directly equivalent to a full fiscal year.
What changed in La Tim’s liquidity and leverage after FY26?
La Tim’s current ratio eased to 1.6 times at H1 FY27 from 1.8 times in FY26 and 1.9 times in FY25. Debt-to-equity rose to 0.9 times at H1 FY27 from 0.6 times in each of the prior two fiscal years, while interest coverage increased to 3.7 times from 2.4 times in FY26 and 0.6 times in FY25.
The H1 FY27 balance sheet records higher borrowings alongside higher current assets. Short-term borrowings increased to Rs 62.3 crore from Rs 42.8 crore at FY26 end, and long-term borrowings rose to Rs 12.6 crore from Rs 7.9 crore. Total assets increased to Rs 236.0 crore from Rs 178.1 crore, including inventories of Rs 102.1 crore and trade receivables of Rs 65.4 crore.
Operating cash flow turned negative in H1 FY27, with Rs 12.7 crore used in operating activities, compared with Rs 0.9 crore generated in FY26. Investing activities used Rs 4.5 crore, while financing activities generated Rs 20.4 crore during the half year. Cash and cash equivalents at the end of H1 FY27 were Rs 5.1 crore, compared with Rs 1.9 crore at FY26 end in the cash-flow statement.
The H1 FY27 cash-flow pattern coincided with a Rs 10.1 crore rise in inventory and a Rs 36.9 crore rise in trade receivables from FY26-end balances. Shareholders’ funds rose to Rs 85.8 crore from Rs 78.7 crore, but total equity and liabilities also increased to Rs 236.0 crore from Rs 178.1 crore. The balance-sheet and cash-flow figures show that the period’s expansion required financing inflows.
Conclusion
La Tim’s FY26 turnaround combined a return to Rs 8.2 crore PAT from a Rs 0.9 crore loss, EBITDA-margin expansion to 4.0% from 0.5%, and ROCE growth to 21.5% from 4.6%. Revenue rose to Rs 390.5 crore, while receivable and net-capital turnover increased, though the presentation gives two different FY26 inventory-turnover figures.
The next results will show whether H1 FY27’s 5.0% EBITDA margin and 23.5% ROCE continue as inventories, receivables and borrowings rise. La Tim is developing value-added coated steel, stone-coated roofing, asphalt shingles and building original equipment manufacturer solutions, while its disclosed Industrial Park plan includes phased land parceling as a potential monetisation avenue.