










Ajax revenue grew 29% CAGR as FY26 EBITDA margin fell to 12.6%
Key highlights
- Ajax revenue rose from Rs 763.3 crore in FY22 to Rs 2,102.5 crore in FY26, a reported 29% CAGR.
- FY26 EBITDA fell to Rs 265.8 crore from Rs 318.1 crore, and EBITDA margin declined to 12.6% from 15.3%.
- SLCM revenue reached Rs 1,757.5 crore in FY26, while non-SLCM and spares and services contributed Rs 345.1 crore combined.
- Ajax’s disclosed cash position increased to Rs 1,120.8 crore in FY26 from Rs 722.4 crore in FY25.
powered by IRIS
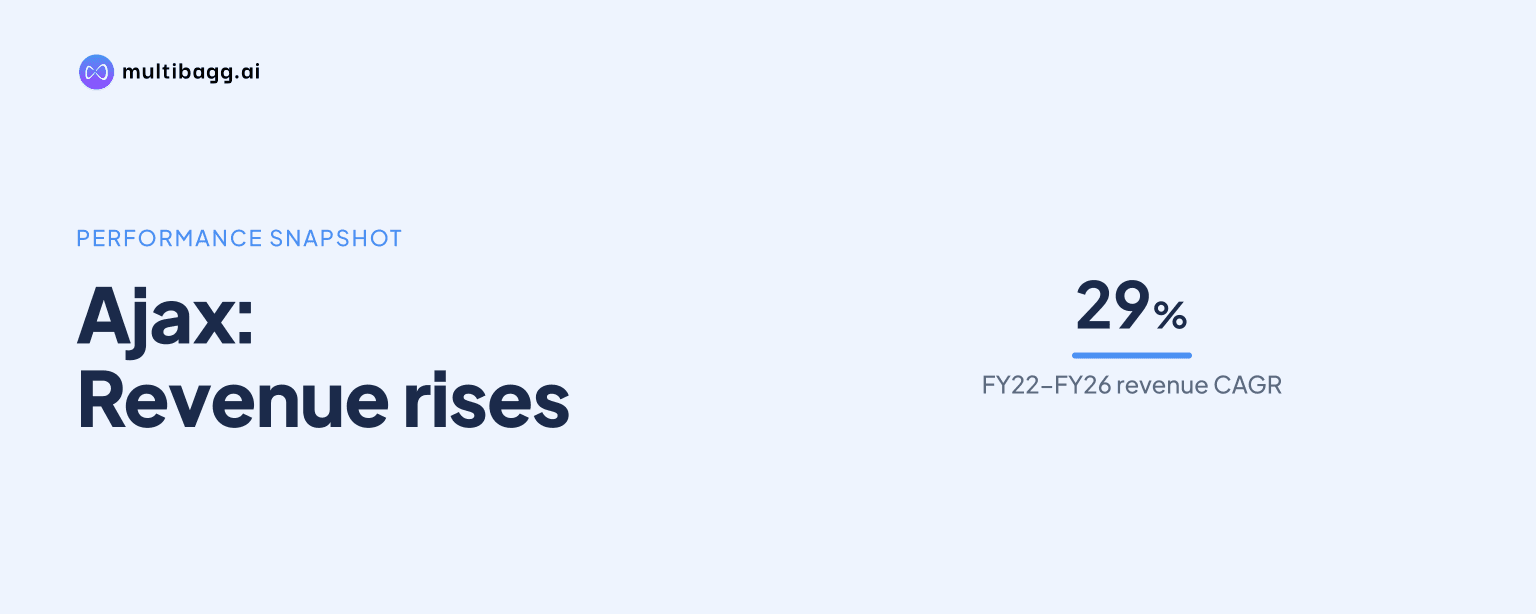
Ajax Engineering Limited reported revenue growth at a 29% compound annual growth rate from FY22 to FY26, reaching Rs 2,102.5 crore, but its EBITDA margin declined to 12.6% in FY26 from 15.3% in FY25. EBITDA fell Rs 52.3 crore to Rs 265.8 crore even as FY26 revenue rose Rs 28.6 crore.
Know Ajax Engineering inside out
Results, valuation, peers and who's buying, in one view.
How fast did Ajax grow revenue and profit through FY26?
Ajax grew revenue from Rs 763.3 crore in FY22 to Rs 2,102.5 crore in FY26, a reported 29% CAGR. Revenue increased to Rs 1,151.1 crore in FY23, Rs 1,741.4 crore in FY24 and Rs 2,073.9 crore in FY25, before growth slowed to 1.4% in FY26. The Rs 28.6 crore FY26 increase was materially below the Rs 332.5 crore increase recorded in FY25.
Ajax reported EBITDA, or earnings before interest, tax, depreciation and amortisation, of Rs 265.8 crore in FY26, compared with Rs 318.1 crore in FY25 and Rs 90.5 crore in FY22. Its reported FY22-to-FY26 EBITDA CAGR was 31%, although FY26 EBITDA was 16.4% below the FY25 figure. Profit after tax, or PAT, fell to Rs 225.1 crore in FY26 from Rs 260.1 crore in FY25, returning to the level reported in FY24.
Profit before tax and exceptional items declined to Rs 304.3 crore in FY26 from Rs 350.9 crore in FY25. FY26 also included an exceptional expense of Rs 3.1 crore, while FY25 had no exceptional income or expense. Other income increased to Rs 49.2 crore from Rs 42.8 crore, but this did not offset the decline in operating profit.
Which Ajax businesses contributed most to FY26 revenue?
Ajax’s self-loading concrete mixer, or SLCM, business was its largest reported revenue line, generating Rs 1,757.5 crore in FY26. SLCM revenue increased from Rs 591.1 crore in FY22 at a reported 31% CAGR, but rose only Rs 4.3 crore from Rs 1,753.2 crore in FY25. The segment had increased Rs 270.7 crore in FY25 from FY24.
Non-SLCM revenue rose to Rs 193.4 crore in FY26 from Rs 99.5 crore in FY22, a reported 18% CAGR. Spares and services increased to Rs 151.7 crore from Rs 72.7 crore, at a reported 20% CAGR. Together, the two businesses contributed Rs 345.1 crore in FY26, up Rs 24.3 crore from Rs 320.8 crore in FY25.
SLCM represented the majority of Ajax’s FY26 revenue based on the reported segment amounts. Gross profit declined to Rs 531.5 crore in FY26 from Rs 562.2 crore in FY25, as cost of goods sold rose to Rs 1,571.1 crore from Rs 1,511.7 crore. Employee cost rose Rs 6 crore to Rs 115.5 crore and other expenses increased Rs 15.6 crore to Rs 150.1 crore; the presentation does not specify the cause of these movements.
Got a follow-up? Ask IRIS
Why did Ajax’s FY26 margins and returns decline?
Ajax’s EBITDA margin declined 2.7 percentage points to 12.6% in FY26 from 15.3% in FY25. The FY26 figure was also below the five-year high of 15.8% in FY24, though it remained 0.7 percentage points above the 11.9% reported in FY22. The margin change accompanied 1.4% revenue growth and a Rs 52.3 crore decline in EBITDA.
Gross margin decreased to 25.3% in FY26 from 27.1% in FY25 and 28.2% in FY22. PAT margin declined to 10.7% from 12.5% in FY25 and 12.9% in FY24. The Rs 30.7 crore decline in gross profit from FY25 to FY26 was followed by a larger Rs 52.3 crore decline in EBITDA.
Return on capital employed, or ROCE, fell to 21.6% in FY26 from 30.2% in FY25, while return on equity, or ROE, fell to 16.2% from 22.5%. Return on invested capital increased to 64.4% from 49.8%, but remained below its FY24 level of 82.0%. Ajax defines ROCE as profit before tax plus finance cost divided by capital employed, and ROE as profit for the period divided by total equity.
How did Ajax’s cash and balance sheet change in FY26?
Ajax’s disclosed cash position increased to Rs 1,120.8 crore in FY26 from Rs 722.4 crore in FY25, while net working-capital days declined to 21 from 31. The cash-position measure includes cash and cash equivalents, fixed deposits and current investments. Current investments rose to Rs 882 crore at March 2026 from Rs 627.1 crore a year earlier, while cash and cash equivalents increased to Rs 165.9 crore from Rs 45.9 crore.
Cash from operations increased to Rs 455.2 crore in FY26 from Rs 130.8 crore in FY25. Net cash flow from operating activities was Rs 377.3 crore, compared with Rs 42.7 crore in FY25, after a Rs 158.6 crore working-capital movement in FY26 versus a Rs 213.3 crore outflow in FY25. Ajax reported cash flow from operations to EBITDA of 141.9% in FY26, against 13.4% in FY25.
Total assets rose to Rs 1,751.7 crore at March 2026 from Rs 1,482.5 crore at March 2025, and total equity increased to Rs 1,392.2 crore from Rs 1,157.1 crore. Inventories fell Rs 92.4 crore to Rs 165.2 crore, while trade receivables rose Rs 14 crore to Rs 178.7 crore. Ajax reported no current borrowings at either March 2026 or March 2025, compared with Rs 6.2 crore at March 2024.
Conclusion
Ajax’s FY22-to-FY26 record shows a substantial expansion in revenue, led by SLCM, alongside a build-up in cash and investments. Yet FY26 differed from FY25: revenue rose only Rs 28.6 crore, while gross profit, EBITDA, PAT, margins, ROCE and ROE all declined. Operating cash flow and the cash position improved as net working-capital days fell to 21.
The presentation does not disclose a company revenue, margin or return target, and it does not identify the cause of the FY26 margin decline. The next reported period should therefore clarify whether SLCM revenue moves beyond its Rs 4.3 crore FY26 increase, whether gross margin recovers from 25.3%, and how Ajax deploys Rs 882 crore of current investments at March 2026.