










All Time Plastics FY26 revenue rose as profitability fell
Key highlights
- alltime’s FY26 revenue rose to Rs 610.4 crore from Rs 558.2 crore in FY25.
- alltime’s FY26 EBITDA margin declined to 14.8% from 18.2% in FY25.
- alltime’s FY26 ROCE fell to 10.3% from 17.0%, while fixed-asset turnover declined to 1.66.
- alltime’s property, plant and equipment rose to Rs 402.8 crore in FY26 from Rs 332.4 crore in FY25.
powered by IRIS
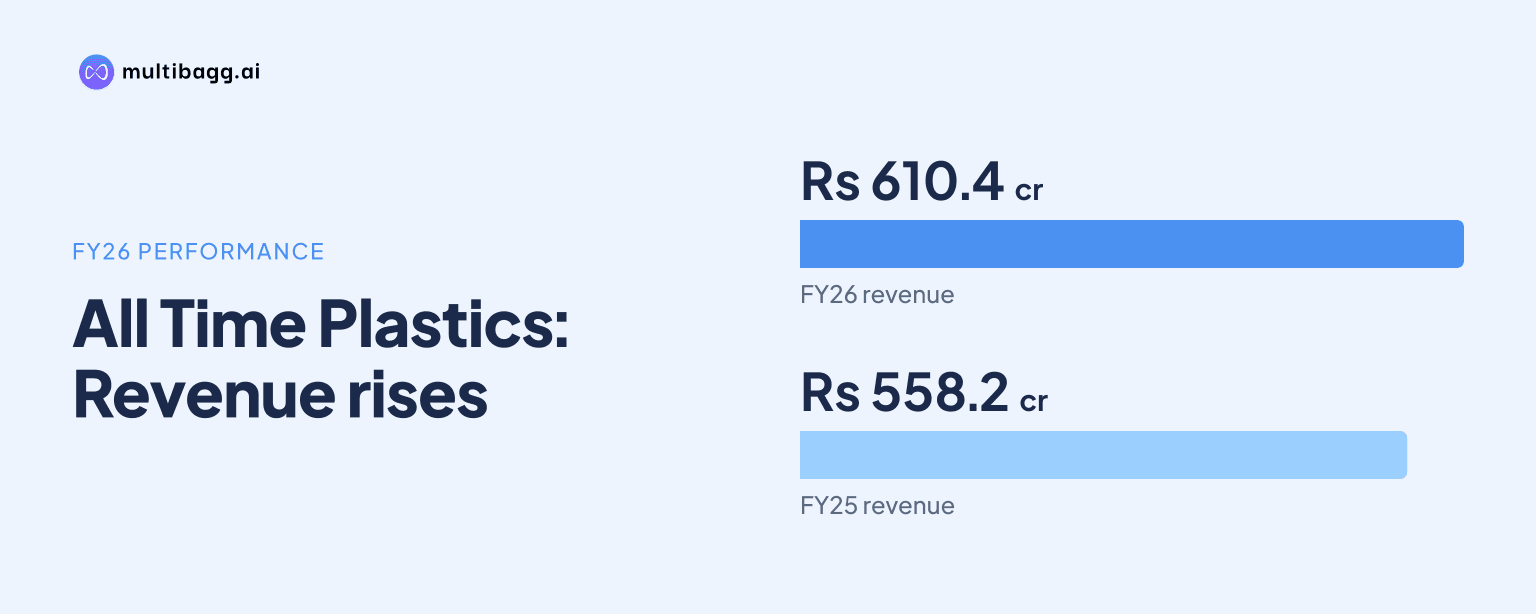
All Time Plastics reported FY26 revenue of Rs 610.4 crore, up from Rs 558.2 crore in FY25, while EBITDA margin fell to 14.8% from 18.2% and return on capital employed declined to 10.3% from 17.0%. The company’s property, plant and equipment increased to Rs 402.8 crore during the year.
Know All Time Plastics inside out
Results, valuation, peers and who's buying, in one view.
What changed in alltime’s FY26 revenue and margins?
alltime’s revenue increased by Rs 52.2 crore, or 9.4%, to Rs 610.4 crore in FY26, but gross, operating and net margins all declined from FY25. Gross profit rose to Rs 239.3 crore from Rs 222.9 crore, yet gross profit margin reduced to 39.2% from 39.9%. The FY26 gross margin was also below the 40.7% reported in FY24.
The divergence widened below gross profit. EBITDA, or earnings before interest, tax, depreciation and amortisation, declined to Rs 90.1 crore in FY26 from Rs 101.3 crore in FY25, and its margin reduced by 3.4 percentage points to 14.8%. EBIT, or earnings before interest and tax, fell to Rs 67.8 crore from Rs 78.9 crore, while EBIT margin decreased to 11.1% from 14.1%.
alltime’s FY26 revenue was Rs 97.5 crore higher than FY24, but EBITDA was Rs 7.0 crore lower than the FY24 level of Rs 97.1 crore. This comparison shows that the two-year increase in sales did not produce a corresponding increase in operating earnings. The presentation reports FY26 consolidated revenue of Rs 610.5 crore and consolidated EBITDA of Rs 89.9 crore, compared with standalone revenue of Rs 610.4 crore and EBITDA of Rs 90.1 crore.
Why did alltime’s FY26 earnings fall despite higher revenue?
alltime’s reported operating costs increased by more than its gross-profit increase in FY26. Employee cost rose by Rs 11.4 crore to Rs 58.7 crore, while other expenses increased by Rs 16.2 crore to Rs 90.5 crore. Together, those two expense lines rose by Rs 27.6 crore, compared with a Rs 16.4 crore increase in gross profit.
Depreciation also increased to Rs 29.0 crore in FY26 from Rs 23.5 crore in FY25, a rise of Rs 5.5 crore. Finance cost was Rs 15.2 crore, close to Rs 14.7 crore a year earlier, while the FY26 profit and loss statement records Rs 4.4 crore of exceptional items. Profit before tax consequently declined to Rs 48.2 crore from Rs 64.2 crore.
alltime’s profit after tax fell by Rs 11.7 crore to Rs 35.6 crore in FY26, and its margin declined to 5.8% from 8.5%. Tax expense reduced to Rs 12.6 crore from Rs 16.9 crore, but this was not enough to offset the Rs 16.0 crore fall in profit before tax. Cash profit after tax also declined to Rs 65 crore from Rs 71 crore in the historical highlights.
How did alltime’s returns and asset utilisation change in FY26?
alltime’s return measures and fixed-asset turnover declined in FY26 as its asset base expanded. Return on capital employed, or ROCE, fell to 10.3% from 17.0% in FY25 and 22.3% in FY24. Return on equity, or ROE, declined to 8.3% from 21.0% in FY25, following 24.9% in FY24.
Fixed-asset turnover reduced to 1.66 in FY26 from 1.99 in FY25 and 2.26 in FY24. Property, plant and equipment increased by Rs 70.4 crore to Rs 402.8 crore, while capital work-in-progress rose by Rs 19.7 crore to Rs 41.6 crore. These two balance-sheet categories totalled Rs 444.4 crore at the FY26 year-end, compared with Rs 354.3 crore in FY25.
Total assets increased to Rs 782.9 crore in FY26 from Rs 562.3 crore in FY25, an increase of Rs 220.6 crore. Non-current assets rose to Rs 481.5 crore from Rs 371.0 crore, and current assets increased to Rs 301.4 crore from Rs 191.3 crore. Revenue increased by Rs 52.2 crore over the same period, alongside the reported reduction in fixed-asset turnover and return ratios.
Got a follow-up? Ask IRIS
What did alltime’s FY26 cash flow, debt and working capital show?
alltime generated Rs 86.3 crore of net cash from operating activities in FY26, compared with Rs 39.4 crore in FY25. Cash generated from operations increased to Rs 96.8 crore from Rs 56.6 crore, while direct taxes paid reduced to Rs 10.5 crore from Rs 17.1 crore. The improvement in operating cash flow came despite the decline in profit after tax to Rs 35.6 crore.
Net cash used in investing activities increased to Rs 183.5 crore in FY26 from Rs 101.1 crore in FY25. Net cash from financing activities was Rs 175.3 crore, compared with Rs 59.4 crore a year earlier. Cash and cash equivalents ended FY26 at Rs 86.5 crore, versus Rs 8.4 crore at the beginning of the year.
Borrowings were lower at the FY26 year-end. Non-current borrowings declined to Rs 55.9 crore from Rs 101.8 crore, and current borrowings fell to Rs 24.4 crore from Rs 116.8 crore. The debt-to-equity ratio reduced to 0.13 from 0.88, while net working-capital days increased to 57 from 50 in FY25 and 33 in FY24.
How did alltime’s FY26 revenue mix change?
alltime’s domestic revenue share increased to 17% in FY26 from 14% in FY25, while export share declined to 83% from 86%. Exports remained the majority of revenue, although their share was also below the 89% recorded in FY24. The presentation does not provide revenue amounts for domestic and export sales.
The European Union remained alltime’s largest geographical market at 58% of FY26 revenue, unchanged from FY25. The United Kingdom’s share fell to 12% from 16%, while the United States increased to 12% from 11% and India rose to 17% from 14%. Other geographies accounted for 1% in both years.
Containers became the largest product category at 39% of FY26 revenue, up from 35% in FY25. Prep Time declined to 34% from 36%, while Organization increased to 15% from 9%. Junior fell to 2% from 7%, and Meal Time reduced to 4% from 5%.
Conclusion
alltime’s FY26 results combined a Rs 52.2 crore revenue increase with lower earnings, margins, returns and fixed-asset turnover. EBITDA declined by Rs 11.2 crore to Rs 90.1 crore and profit after tax fell by Rs 11.7 crore to Rs 35.6 crore, while property, plant and equipment and capital work-in-progress together rose to Rs 444.4 crore.
The presentation does not disclose a target, timetable or expected revenue contribution for the Rs 41.6 crore of capital work-in-progress. The next financial disclosures will therefore clarify whether the enlarged asset base improves fixed-asset turnover from 1.66, and whether operating margins and net working-capital days of 57 change from FY26 levels.