










Anawil H1FY27 revenue breaks its historical H2-heavy pattern
Key highlights
- Anawil reported Rs 154 crore of revenue in H1FY27, compared with Rs 41 crore in H1FY26.
- Anawil's H1FY27 revenue exceeded its Rs 143 crore revenue from operations for all of FY26.
- Historically, Anawil says 70–80% of annual revenue has been generated in H2.
- Anawil had a Rs 395.6 crore order book for 320 towers as of October 31, 2026.
powered by IRIS
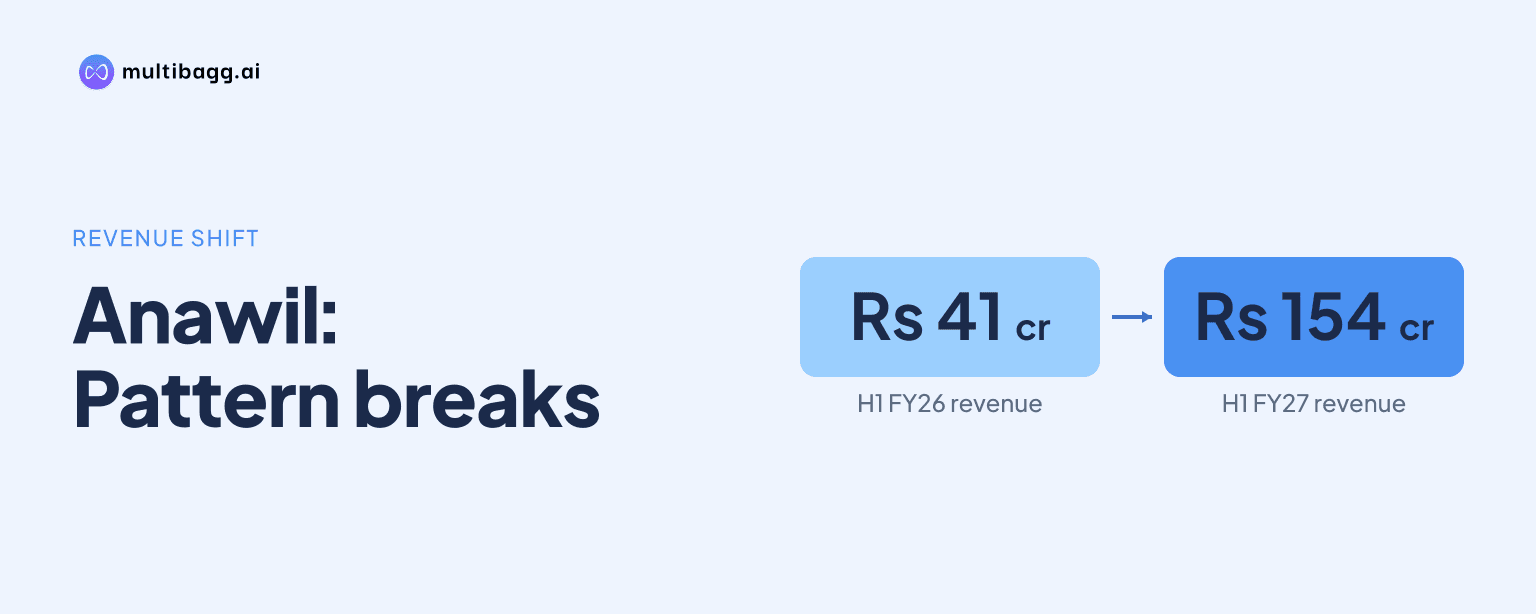
Anawil Wind and Engineering Ltd reported Rs 154 crore of revenue in H1FY27, exceeding its Rs 143 crore revenue from operations for all of FY26 despite stating that H2 has historically generated 70–80% of annual revenue. The April–September result was also Rs 113 crore above the Rs 41 crore reported in H1FY26.
Know Anawil Wire and Engineering inside out
Results, valuation, peers and who's buying, in one view.
What changed in Anawil's H1FY27 revenue pattern?
The change is that Anawil generated Rs 154 crore in April–September of H1FY27, compared with Rs 41 crore in H1FY26. The increase was Rs 113 crore, and the H1FY27 amount was Rs 11 crore above the Rs 143 crore revenue from operations reported for all of FY26.
Historically, Anawil has described H1 as contributing about 20–30% of annual revenue, while H2, from October to March, has contributed about 70–80%. No FY27 revenue forecast is disclosed, but the Rs 154 crore in H1FY27 was greater than every full-year revenue figure presented for FY24, FY25 and FY26: Rs 54 crore, Rs 79 crore and Rs 143 crore, respectively.
How does H1FY27 compare with Anawil's earlier seasonal splits?
H1FY27 differs from each of the three prior financial years displayed because H2 had previously generated more revenue than H1. In FY24, H1 revenue was Rs 16 crore and H2 revenue was Rs 38 crore; in FY25, the corresponding figures were Rs 16 crore and Rs 63 crore. FY26 H1 revenue rose to Rs 41 crore, while H2 remained higher at Rs 102 crore.
The displayed figures indicate that H2 represented about 70% of FY24 revenue, about 80% of FY25 revenue and about 71% of FY26 revenue. That is consistent with Anawil's stated 70–80% historical H2 range. By comparison, H1FY27 revenue of Rs 154 crore was already Rs 52 crore higher than the Rs 102 crore H2 revenue shown for FY26.
Why has Anawil historically generated more revenue in H2?
Anawil attributes its normal H2 concentration to project-execution conditions from October to March, when weather and site accessibility are typically more favourable for wind turbine tower installation. It identifies monsoon conditions, site access and project readiness as factors influencing tower dispatches in H1, which it historically places at about 20–30% of annual revenue.
Customer project schedules and site readiness also determine when production and dispatch can occur, according to Anawil. The company says transportation planning for oversized towers supports delivery and execution; these operating factors sit behind its historical allocation of about 70–80% of annual revenue to H2. The presentation does not identify the customer orders or project schedules that produced the Rs 154 crore H1FY27 result.
Got a follow-up? Ask IRIS
What order book supports Anawil's execution visibility?
Anawil reported an order book of Rs 395.6 crore covering 320 towers for eight customers as of October 31, 2026, and expects to execute it by Q1FY28. The order book was more than twice the Rs 154 crore H1FY27 revenue, although this comparison does not constitute a revenue forecast because execution depends on customer schedules, site readiness and dispatch conditions.
Integrated supply represented 51% of the Rs 395.6 crore order book, while pure conversion accounted for 25% and conversion plus internals for 24%. The largest disclosed line was Rs 134 crore for 38 WTG Towers, followed by Rs 58.3 crore for 10 Envision WTG Towers and Rs 55.8 crore for 95 SANY WTG Towers. Anawil also disclosed letters of intent worth Rs 44.1 crore for 44 towers.
What other figures place Anawil's revenue shift in context?
Anawil's FY26 revenue from operations of Rs 143 crore was Rs 64 crore higher than FY25 revenue of Rs 79 crore, following Rs 54 crore in FY24. Earnings before interest, tax, depreciation and amortisation, or EBITDA, reached Rs 61 crore in FY26 at a 43% margin, compared with Rs 30 crore at a 38% margin in FY25. Profit after tax increased to Rs 36 crore from Rs 12 crore, while the reported margin rose from 16% to 25%.
FY26 geographic revenue was Rs 134.49 crore from Karnataka and Rs 8.78 crore from Gujarat, compared with Rs 78.55 crore and Rs 0.04 crore, respectively, in FY25. Anawil says its new Gujarat facility complements established Karnataka operations. Gujarat and Karnataka together account for about 44% of India's installed wind capacity of 58.52 gigawatts, according to the presentation, but it provides no revenue target or ramp-up timetable for the Gujarat facility.
Conclusion
Anawil's Rs 154 crore H1FY27 revenue marks a break from the FY24-to-FY26 pattern, when H2 revenue was Rs 38 crore, Rs 63 crore and Rs 102 crore and represented roughly 70–80% of annual revenue. The first-half result also exceeded FY26's full-year Rs 143 crore revenue from operations, making the timing of execution a central feature of the disclosed performance change.
The next disclosed milestone is execution of the Rs 395.6 crore, 320-tower order book by Q1FY28, alongside Rs 44.1 crore of letters of intent reported as of October 31, 2026. The relevant factor to watch is how dispatches progress across H2FY27 and later periods, given that Anawil continues to identify weather, site access, project readiness and oversized-tower logistics as determinants of execution timing.