










AnZen debt totals Rs 4,900 crore, 74% after five years
Key highlights
- AnZen reported total debt of Rs 4,900 crore and a weighted-average residual maturity of 11.7 years at September 30, 2026.
- AnZen has 74% of debt maturing after five years, while 14% matures within zero to two years.
- AnZen's debt mix is 70% floating rate and 30% fixed rate, with a 7.57% trust-level weighted-average interest rate.
- NaBFID represents 46% of AnZen's lender allocation and SBI/SBI Mutual Fund represents 31%.
powered by IRIS
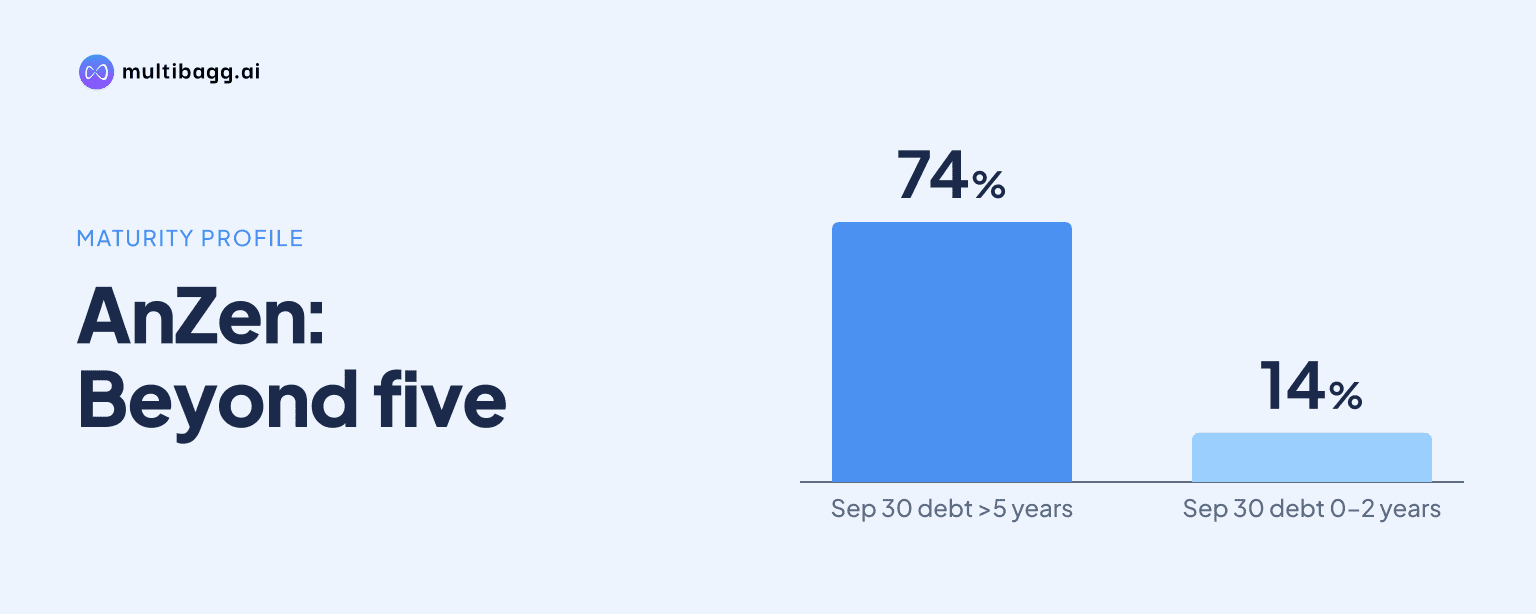
AnZen India Energy Trust (AnZen) reported total debt of Rs 4,900 crore as of September 30, 2026, with 74% maturing after five years and a weighted-average residual maturity of 11.7 years. The debt portfolio was 70% floating rate, while net debt represented 51.25% of assets under management (AUM).
Know Anzen India Energy Yield Plus Trust inside out
Results, valuation, peers and who's buying, in one view.
How much debt does AnZen have?
AnZen reported total debt of Rs 4,900 crore in its September 2026 debt portfolio disclosure. The total includes special purpose vehicle (SPV) debt for the Sigma portfolio corresponding to AnZen's 74% stake. AnZen reported AUM of Rs 8,650 crore at September 2026, compared with Rs 6,560 crore at March 2026.
Net debt divided by AUM was 51.25%, while the ratio was 48.8% excluding the Engie shareholder loan. The 2.45 percentage-point difference shows the effect of that shareholder loan on the disclosed leverage calculation. The debt presentation does not provide a comparable earlier-period debt balance or net-debt-to-AUM figure.
AnZen disclosed weighted-average interest rates of 7.57% at the trust level and 7.59% at the SPV level, calculated on outstanding amounts as of September 30, 2026. The 0.02 percentage-point difference between the two rates is limited, while the presentation describes the overall cost of debt as around 7.6%.
When does AnZen's debt mature?
AnZen has 74% of its debt maturing after five years, 12% maturing in two to five years and 14% maturing within zero to two years. The weighted-average residual maturity was 11.7 years as of September 30, 2026. The maturity split puts the largest share of borrowings beyond the five-year mark.
The 14% due within zero to two years is the nearest disclosed refinancing bucket, while 86% of debt matures after two years. Management said the 74% share maturing after five years reduces near-term refinancing risk. The presentation does not disclose a year-by-year repayment schedule, replacement facilities or facility-level maturity dates for the zero-to-two-year bucket.
Got a follow-up? Ask IRIS
How exposed is AnZen to interest-rate movements?
AnZen has 70% of borrowings at floating rates and 30% at fixed rates, meaning variable-rate instruments form the larger part of its Rs 4,900 crore debt portfolio. The weighted-average trust and SPV borrowing rates were 7.57% and 7.59%, respectively, at September 30, 2026.
AnZen's funding sources consist of 70% term loans and 30% non-convertible debentures (NCDs). The matching 70% proportions for floating-rate debt and term loans do not show that every term loan has floating pricing, because the presentation reports debt type and funding source as separate classifications. It does establish that both term loans and floating-rate debt account for the majority of the portfolio.
The presentation gives operating figures alongside the financing disclosure but does not provide an interest-coverage ratio. Consolidated total income rose to Rs 300.4 crore in Q2 FY27 from Rs 103.1 crore in Q2 FY26, while consolidated earnings before interest, tax, depreciation and amortisation (EBITDA) increased to Rs 253.7 crore from Rs 82.5 crore. These financial figures include 100% of Sigma portfolio revenue and EBITDA, according to the presentation note.
Which lenders fund AnZen and how concentrated is its debt?
AnZen identifies NaBFID as its largest lender group at 46% of total debt, followed by SBI and SBI Mutual Fund at 31%, Axis at 12%, IIFCL at 5% and other lenders at 6%. NaBFID is the National Bank for Financing Infrastructure and Development. Management describes the lender base as diversified and says there is no single-lender concentration risk.
NaBFID and SBI/SBI Mutual Fund together represent 77% of the reported lender allocation, while adding Axis takes the three largest groups to 89%. IIFCL and other lenders account for the remaining 11%. The presentation does not disclose individual facility amounts, collateral terms, covenants or maturity dates by lender.
AnZen's debt page also carries an AAA-rated label and names CRISIL Ratings and India Ratings & Research. The page does not specify whether that label applies to AnZen, a particular debt instrument or every facility. The portfolio comprises 16 projects in eight states, including about 1,244 megawatt-peak of solar assets and about 1,835 circuit kilometres of transmission assets plus two substations.
Conclusion
AnZen's debt profile combines a Rs 4,900 crore borrowing base with a maturity structure weighted toward the longer term, while its financing remains predominantly floating rate and concentrated among the two largest disclosed lender groups. The 51.25% net-debt-to-AUM measure falls to 48.8% excluding the Engie shareholder loan, showing that loan's effect on the reported ratio.
The next debt disclosure will be important for detail on the 14% due within zero to two years, including any refinancing actions or changes in maturity allocation. Investors can also watch whether the 70% floating-rate share and the 7.57% trust-level weighted-average borrowing rate change from the September 30, 2026 position.