










Anzen fair-value NAV rises to Rs 129.61 per unit in September
Key highlights
- Anzen’s fair-value NAV rose to Rs 129.61 per unit at 30 September 2026 from Rs 124.78 at 31 March 2026.
- Anzen reported Rs 373.05 crore of total return for the six months ended 30 September 2026, including Rs 312.411 crore of fair-value changes.
- Net distributable cash flow increased to Rs 211.058 crore for the six months ended 30 September 2026 from Rs 107.676 crore a year earlier.
- Anzen issued 80.34 million units for Rs 1,004.300 crore during the six months, taking outstanding units to 336.06 million.
powered by IRIS
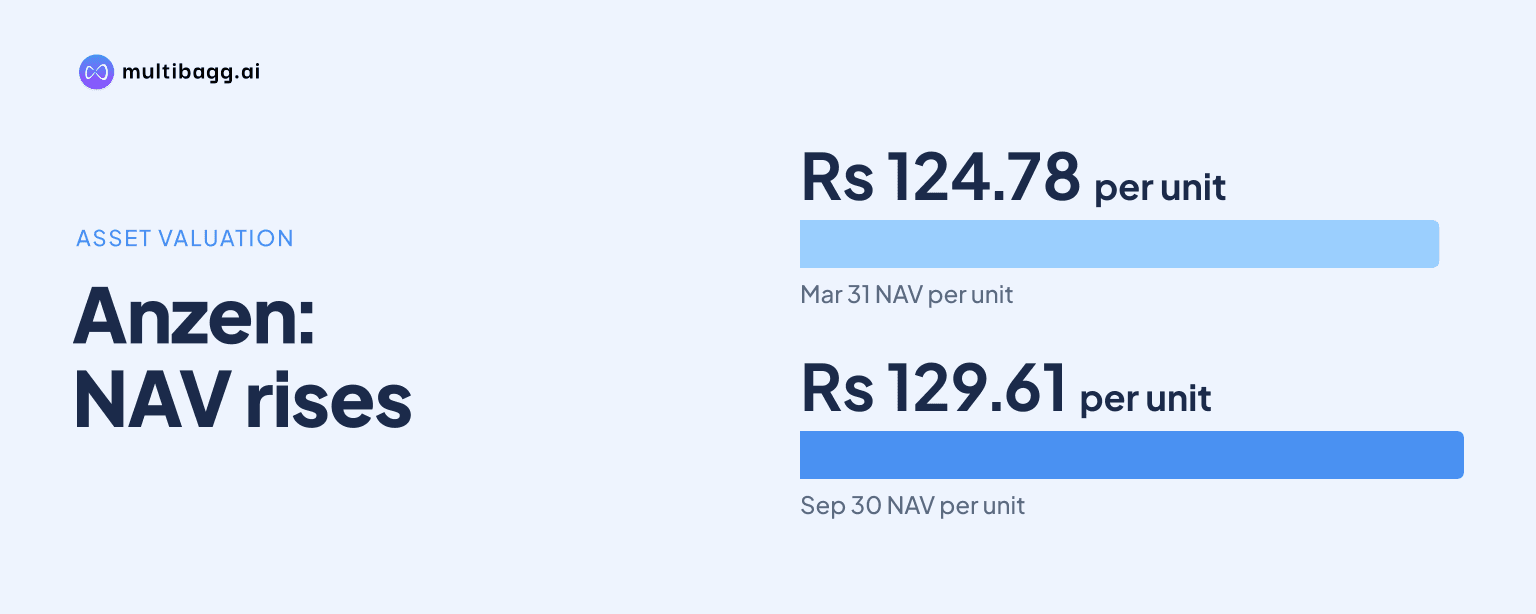
Anzen India Energy Yield Plus Trust reported fair-value net asset value, or NAV, of Rs 129.61 per unit at 30 September 2026, up from Rs 124.78 at 31 March 2026. Anzen recorded Rs 373.05 crore of total return for the six months, including Rs 312.411 crore of fair-value changes outside total comprehensive income.
Know Anzen India Energy Yield Plus Trust inside out
Results, valuation, peers and who's buying, in one view.
What was Anzen’s fair-value NAV at 30 September 2026?
Anzen’s fair-value NAV was Rs 129.61 per unit at 30 September 2026, compared with book-value NAV of Rs 85.91 per unit. Fair-value net assets attributable to unitholders were Rs 4,355.830 crore, against book-value net assets attributable to unitholders of Rs 2,887.177 crore. Both calculations used 336.06 million units.
The fair-value NAV increased by Rs 4.83 per unit from Rs 124.78 at 31 March 2026. It was also Rs 14.39 per unit above the Rs 115.22 reported at 30 September 2025. Book-value NAV rose to Rs 85.91 from Rs 79.56 at 31 March 2026 and Rs 73.90 a year earlier.
The disclosed increase in fair-value NAV occurred alongside an expansion in the unit base. Anzen had 255.72 million units at 31 March 2026, compared with 336.06 million units at 30 September 2026. The per-unit outcome therefore reflects both the fair-value net asset calculation and the number of units outstanding at each reporting date.
Why is Anzen’s fair-value NAV higher than book-value NAV?
Anzen’s fair-value NAV was Rs 43.70 per unit higher than its book-value NAV because its fair-value statement applies the independent valuer’s asset values while retaining liabilities at book value. At 30 September 2026, fair-value net assets before the non-controlling interest deduction were Rs 4,609.811 crore, compared with book-value net assets of Rs 2,973.720 crore.
The fair-value calculation deducted Rs 253.475 crore of non-controlling interest, resulting in Rs 4,355.830 crore of net assets attributable to unitholders. The book-value calculation deducted Rs 86.543 crore of non-controlling interest, resulting in Rs 2,887.177 crore attributable to unitholders. The different treatment of asset values and non-controlling interests accounts for the gap between the two NAV measures.
Anzen’s fair-value assets were Rs 10,626.905 crore at 30 September 2026, while liabilities at book value were Rs 6,017.094 crore. Its book-value assets were Rs 8,990.814 crore against the same Rs 6,017.094 crore of liabilities. The filing says the fair-value assessment is based on reports from an independent valuer appointed by the investment manager under InvIT regulations.
The valuation reconciliation describes other adjustments as including cash and cash equivalents, other bank balances, fixed deposits, mutual-fund investments, external borrowings and interest, fair value attributable to minority interest, and net assets not included in enterprise value. The filing also says that certain economic and beneficial interests in amounts due to special purpose vehicles, or SPVs, for periods through 31 March 2022 were not considered in asset fair values under the stated securities purchase arrangement.
How much of Anzen’s return came from fair-value changes?
Anzen recorded Rs 373.05 crore of total return for the six months ended 30 September 2026, of which Rs 312.411 crore came from other fair-value changes not recognised in total comprehensive income. Total comprehensive income, as reported in the statement of profit and loss, was Rs 60.639 crore. Fair-value changes therefore represented most of the reported total return for the period.
For the six months ended 30 September 2025, Anzen reported Rs 154.316 crore of total return, comprising Rs 152.822 crore of other fair-value changes and Rs 1.434 crore of total comprehensive income. Total return increased by Rs 218.734 crore year on year. The increase in other fair-value changes was Rs 159.589 crore, while total comprehensive income increased by Rs 59.205 crore.
For the year ended 31 March 2026, Anzen reported Rs 497.80 crore of total return, including Rs 400.440 crore of other fair-value changes. The annual statement recorded a total comprehensive loss of Rs 64 lakh. The fair-value total-return measure is therefore separate from cash generation, distributions and accounting profit or loss.
Got a follow-up? Ask IRIS
What changed in Anzen’s assets, units and borrowings?
Anzen’s consolidated assets increased to Rs 8,990.814 crore at 30 September 2026 from Rs 7,319.469 crore at 31 March 2026. Property, plant and equipment increased to Rs 7,767.716 crore from Rs 5,836.564 crore, a rise of Rs 1,931.152 crore. Current investments rose to Rs 420.865 crore from Rs 206.830 crore.
Cash and cash equivalents moved in the opposite direction, declining to Rs 41.030 crore at 30 September 2026 from Rs 636.013 crore at 31 March 2026. The consolidated cash-flow statement reported net cash used in financing activities of Rs 1,117.521 crore for the six months ended 30 September 2026, compared with Rs 194.366 crore used in the year-earlier period.
Unit capital rose to Rs 3,655.792 crore at 30 September 2026 from Rs 2,651.819 crore at 31 March 2026. Anzen issued 80.34 million units during the six months for Rs 1,004.300 crore, with issue expenses of Rs 1.327 crore. This issuance raised the outstanding unit count by 80.34 million from the 255.72 million reported at the start of the financial year.
Non-current borrowings increased to Rs 5,380.094 crore at 30 September 2026 from Rs 4,244.910 crore at 31 March 2026. Current borrowings fell to Rs 138.874 crore from Rs 737.844 crore over the same period. The cash-flow statement separately records Rs 1,509.786 crore of refinancing proceeds and Rs 655.708 crore of term-loan repayments during the six months.
What does Anzen’s distributable cash-flow disclosure show?
Anzen reported net distributable cash flows, or NDCF, of Rs 211.058 crore for the six months ended 30 September 2026, compared with Rs 107.676 crore for the six months ended 30 September 2025. Cash flows received from SPVs totalled Rs 350.961 crore, while finance costs were Rs 113.760 crore and trust-level debt repayment was Rs 14.849 crore.
Trust operating cash flow was negative Rs 13.853 crore for the latest six-month period, while treasury income was Rs 2.565 crore. These inputs reconcile to the reported NDCF under the framework disclosed by Anzen. NDCF is a cash-flow measure and is not equivalent to the Rs 373.05 crore fair-value total return.
For the quarter ended 30 September 2026, the board of directors of Anzen’s investment manager approved a distribution of Rs 3 per unit. The filing states that it is to be paid within five working days from the record date. It also states that Rs 92.417 crore was paid during the six months ended 30 September 2026 in relation to the quarter ended 31 March 2026.
Conclusion
Anzen’s disclosures show that fair-value NAV rose to Rs 129.61 per unit at 30 September 2026, while book-value NAV was Rs 85.91. The difference reflects independent-valuer-based asset values and related adjustments. Fair-value changes of Rs 312.411 crore accounted for most of the Rs 373.05 crore six-month total return, exceeding the Rs 60.639 crore contribution from total comprehensive income.
The next disclosed event to watch is payment of the Rs 3-per-unit distribution for the quarter ended 30 September 2026, which is due within five working days from the record date. Future reporting will also show whether changes in portfolio valuation, the larger 336.06 million-unit base and the movement between current and non-current borrowings continue to shape NAV and total return.